What’s New: Ingest Monitoring
Any error encountered during data ingest is now automatically forwarded to the System Datastream for heightened visibility.
Errors are a fact of life. There is no way to avoid them all, and that’s a big part of why we created Observe: to help our users find errors in their systems and quickly troubleshoot them while saving money.
The first step to doing that is to ingest raw observability data into Observe—logs, traces, metrics, etc. But what happens when that ingest process encounters an error? Typically Observe returns an HTTP response containing an error status code and a message to the ingest request that encountered an error. But, that puts the onus on our users to monitor all their ingest responses for any problems—an extra burden that engineers don’t need.
These responses might be handled deep down in the tech stack, or worse, hidden by third-party systems, meaning that it can be hard to notice when some observations go missing. Not good!
To help our users avoid this situation, we have released a new feature, Ingest Monitoring. Any error encountered during data ingest is now automatically forwarded to the System Datastream for heightened visibility.
Viewing Ingest Errors
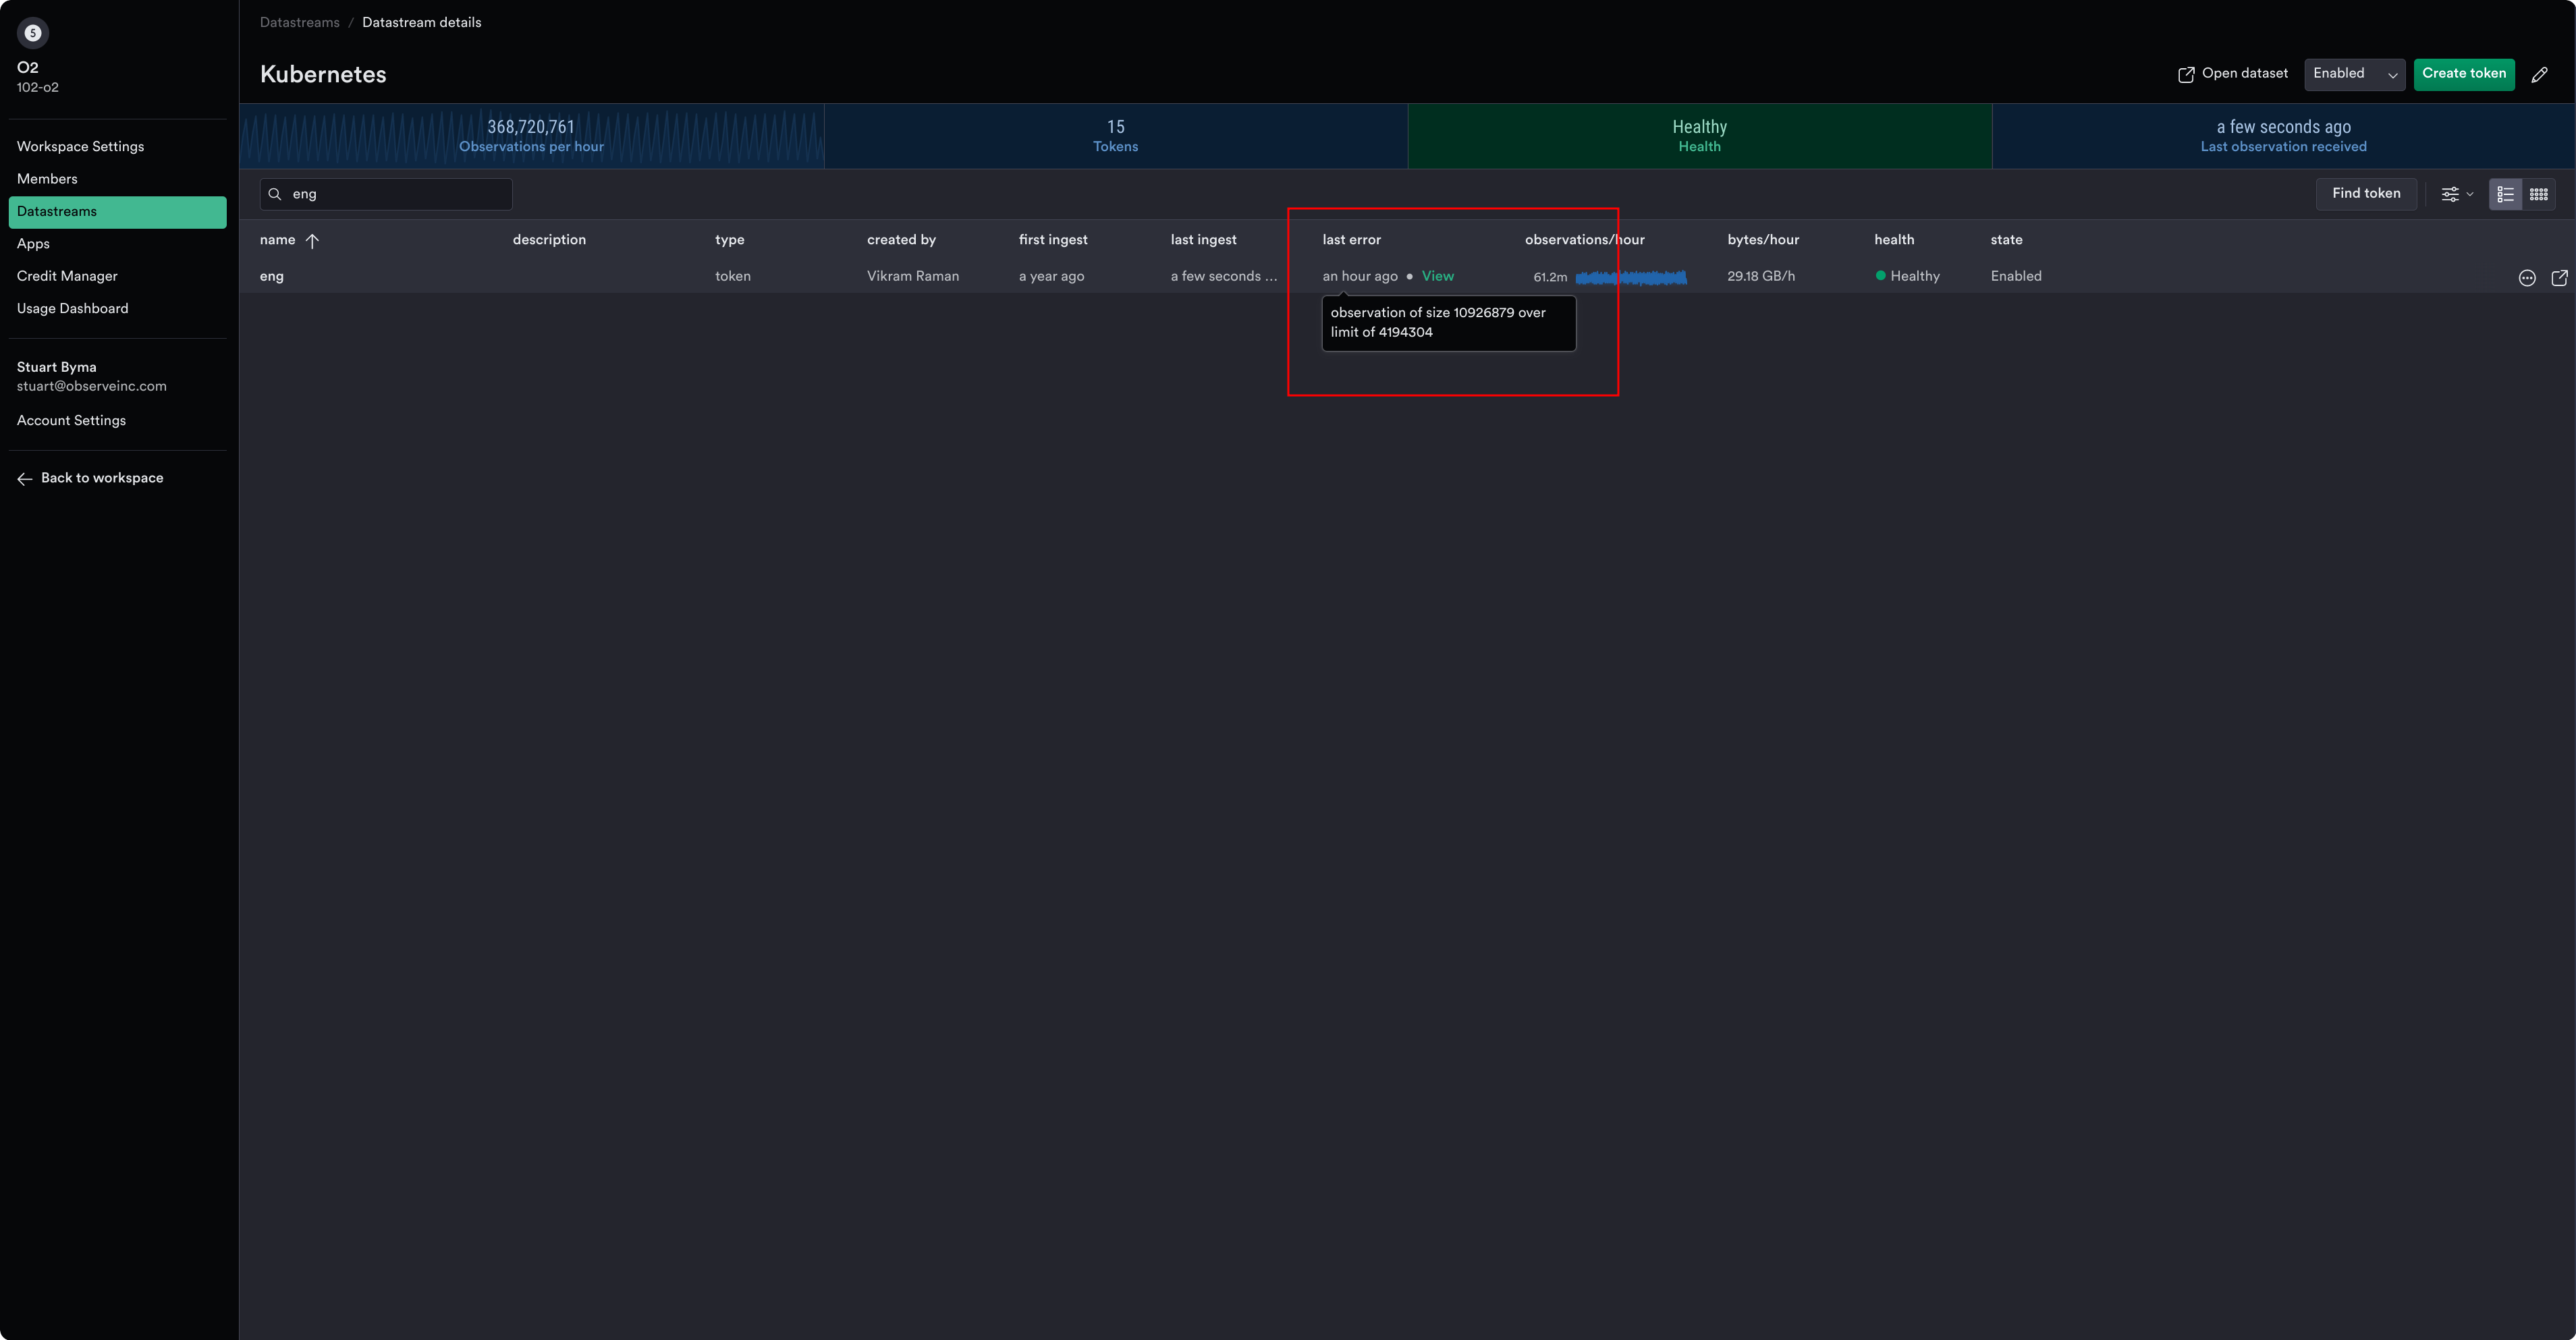
Thanks to this latest feature, it couldn’t be easier to check for ingest errors in your workspace. Simply navigate to Settings -> Workspace Settings -> Datastreams, and then select a datastream.
Each datastream entry has a “last error” column, showing when the last ingest error occurred. Hovering over the “view” hotlink shows a tooltip with the exact error indicated:

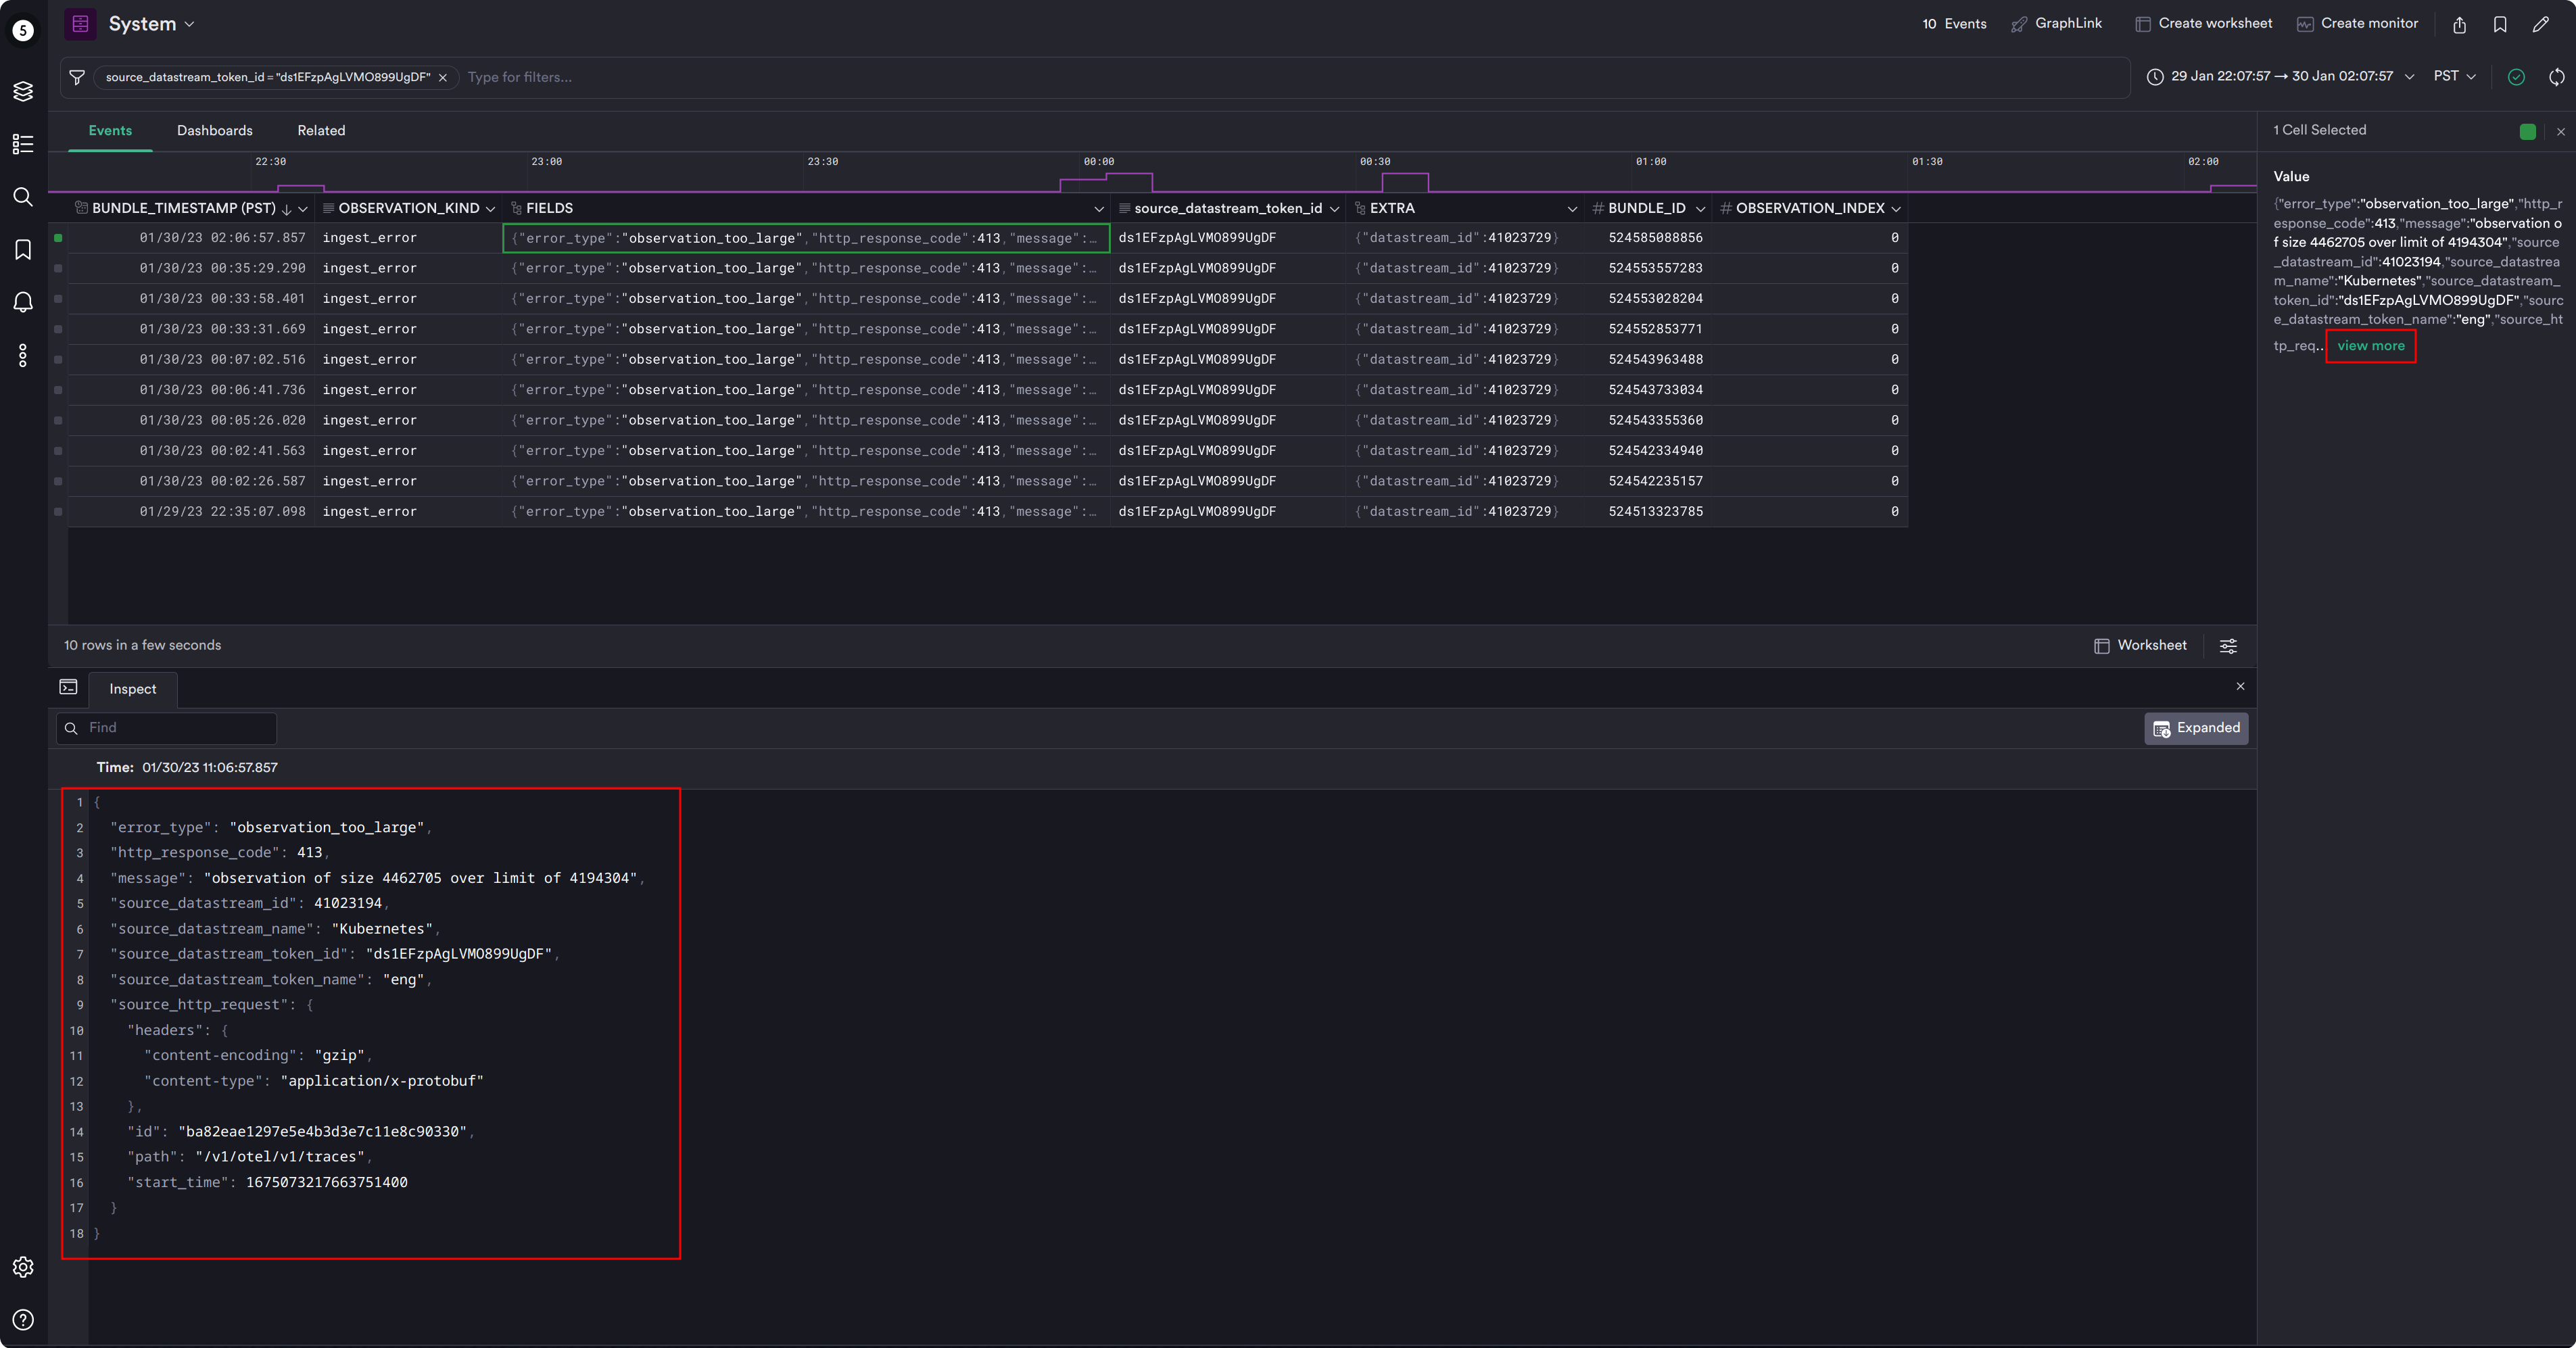
Let’s click the “view” link. From there, Observe takes us to the System Datastream, with some basic filters in place to show the latest error for this datastream. Pick a row, select the FIELDS column, and click “view more” to see the entire ingest error observation.

Uh oh, it looks like this observation is over the size limit supported by Observe. Whoops!
Observe Ingest Monitoring provide tons of information to help debug any ingest errors, including the source datastream information, the endpoint where the request was directed to, the time the request was received, and even the content type of the request. We can see that this one was a gzipped OpenTelemetry trace sent in Protobuf format.
Tips and Tricks
Ingest errors debugging tip: Set the X-Request-Id header on the ingest HTTP requests you send to Observe, and use a per-request ID that can identify the product, service, or endpoint that sent the request. If an ingest error occurs, the Observe Ingest Error in the System Datastream records this request ID (in source_http_request::id), allowing you to perform a quick correlation to pinpoint the source of the error and fix it.
Until Next Time…
As helpful as Ingest Monitoring is, there will be times when you need more guidance in troubleshooting data ingestion errors. Check out the Troubleshooting Data Ingestion page in our docs for additional information on how to troubleshoot these types of errors, as well as a list of ingestion error types, and much more.
If you’d like to know more about this feature or are stuck, visit Observe Support on Slack (channel #support) and one of our engineers will be happy to help!

