Why Observe - Part 1: The Early Days

In late 2017, Observe’s founding team, along with our seed investors at Sutter Hill Ventures, embarked on a mission to build a new kind of Observability product, one fundamentally oriented around bringing together a wide variety of sources and types of machine data. With our initial company launch imminent, I wanted to take a moment to reflect on the trends we saw when we set out on this adventure, the convictions we’ve developed along the way while building our solution, and how these ideas manifest in the product you see today (with an eye towards where this all goes in the future).
Observe was founded based on the simple idea that useful insights can be gained by correlating and analyzing all of the disparate machine data (e.g. logs, traces, metrics, user actions, etc.) generated and emitted by systems going about their everyday business (e.g. servicing user requests, performing background maintenance tasks, etc.). We believed that by organizing this overwhelming body of machine data into a graph of related events, our users could more quickly navigate it, and more accurately derive useful insight from it than in the absence of that contextual structure. We believed that a variety of useful applications and use-cases could be delivered on top of a platform that could manage and contextualize machine data of any sort at large scale, including application performance monitoring, infrastructure monitoring, product usage analytics, security monitoring, and ultimately business performance monitoring. After all, the raw activity logs and metrics generated by machines during the course of their day are often the most timely and accurate record of what is actually happening in a digital business.
We believed that by organizing this overwhelming body of machine data into a graph of related events, our users could more quickly navigate it, and more accurately derive useful insight from it than in the absence of that contextual structure.
Crucially, we recognized that delivering a best-in-class Observability experience was all about context: For a given incident, what machines, services, or customers are affected? What related events happened around the time of the incident? Answering these questions quickly, accurately, and at scale goes beyond dashboarding and keyword search: we wanted to deliver a product that truly understood time and the (often ephemeral) relationships between events and objects in the environment (like servers, users, payments, etc.).
When Observe was founded, industry zeitgeist seemed to be converging on the idea that achieving “Observability” meant bringing the “three pillars of observability” together: logs, metrics, and traces. To date, bringing these together has generally meant either (a) attaching common tags (ala Datadog) or labels (ala Loki/Prometheus) to all of this telemetry, or (b) instrumenting an application with pervasive instrumentation for request tracing (ala OpenTracing) so that a common trace identifier can be followed to correlate these disparate telemetry. Truth be told, we were quite taken with the nascent OpenTracing specification when we started out, and had imagined our own data model would resemble it.
Nevertheless, once we started to scratch beneath the surface, we saw both of these contemporary approaches falling far short of our overall vision. For starters, these approaches seemed to generate their own little silos of data: they worked great if you happened to collect all the data with the same agent or managed to consistently implement a tracing SDK across your entire infrastructure. However, most environments we encountered were much more eclectic than this, with a variety of generations of software and 3rd party services involved in operating a business, and little opportunity (or motivation) to enforce one instrumentation strategy across the board. It became evident to us that pragmatically achieving Observability over a complex infrastructure would require admitting a lot of data “as-is”.
More importantly, we found that the approach to “Observability” of simply bringing logs, metrics, and traces together seemed to miss the bigger picture, sort of like the “blind men and the elephant” parable. That is, at the end of the day, I have questions about the health of the services I manage or the engagement of my users (the elephant), not about my raw logs, metrics, and traces (the blind men). All of this telemetry data we collect and correlate is ultimately in service of asking questions about these higher-level “things”, rather than asking questions about the machine data itself.
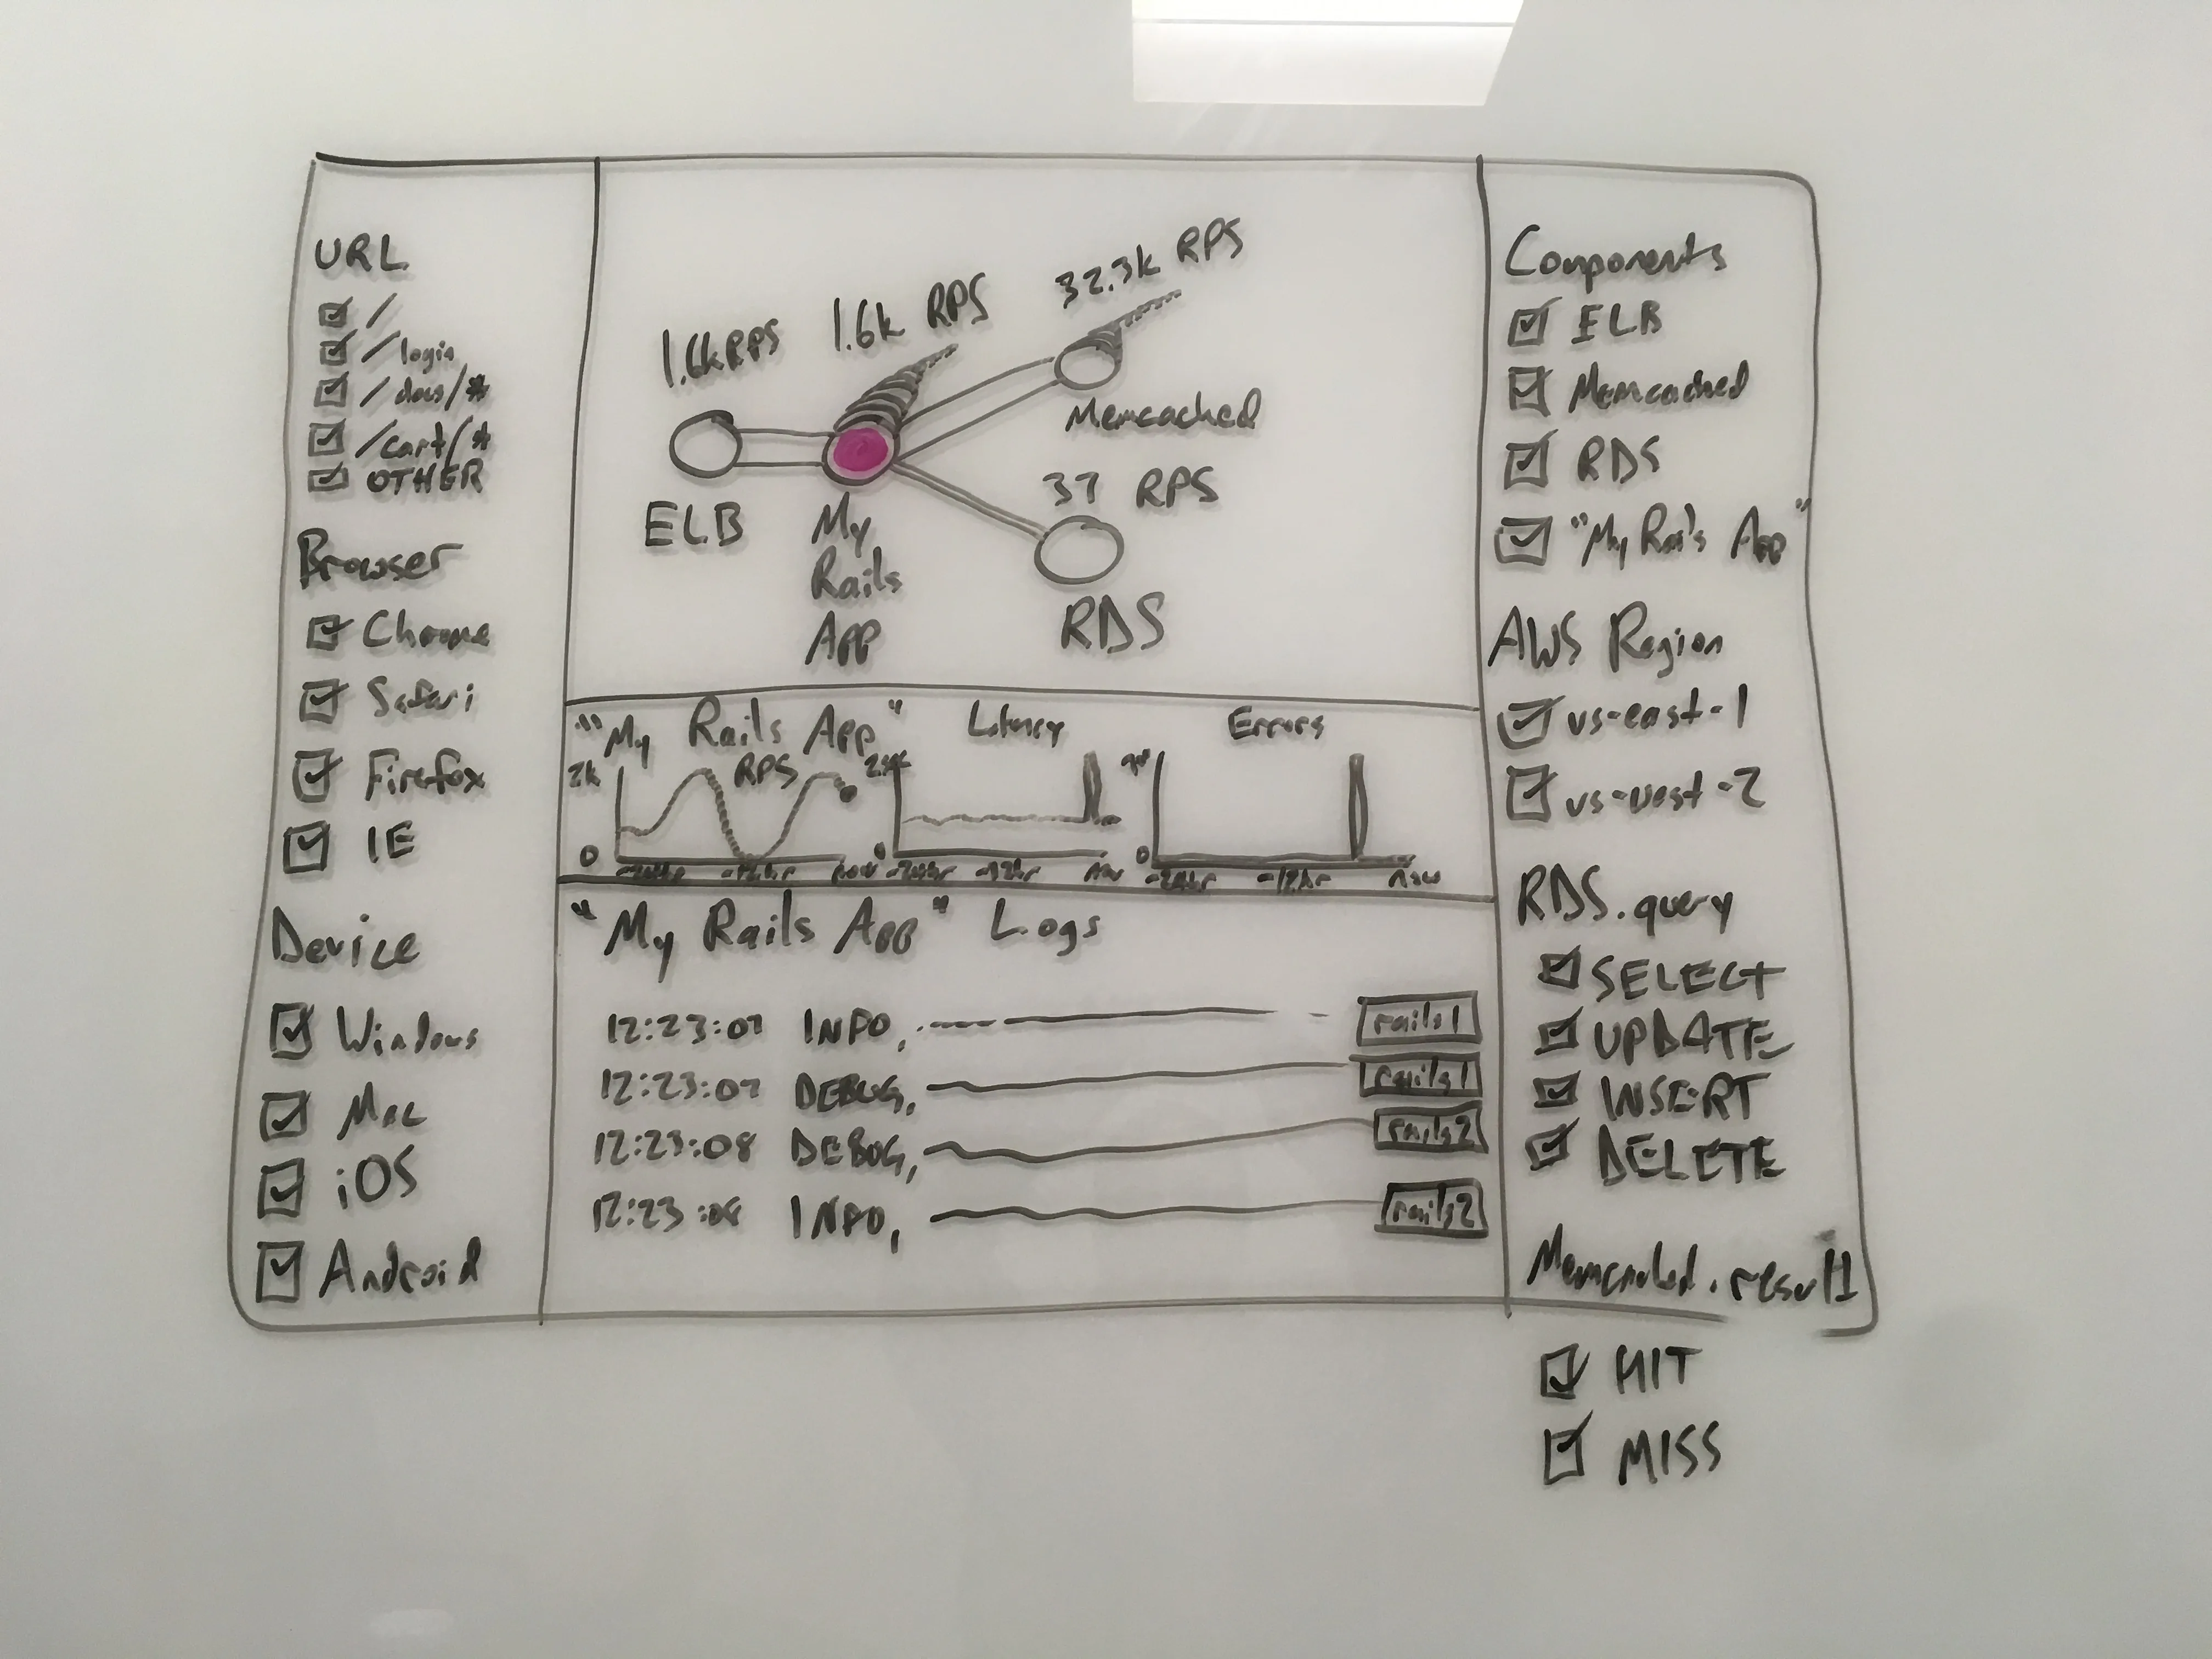
This insight became crystal clear to us early on when we started working on a proof-of-concept Application Performance Monitoring (APM) workflow on top of OpenTracing telemetry. We found that in order to provide a user experience and workflow as richly “opinionated” as you’d expect from a first-class APM product (like New Relic or App Dynamics), it wasn’t enough to just take in any generic tracing instrumentation and provide a few visualizations on top of it. Instead, we found ourselves carefully prescribing which tags had to be present in Span records (in order to identify microservices, users, or errors), and we began hard-coding an increasingly elaborate ontology of the environment we were monitoring into our proof-of-concept application (with purpose-built APIs and endpoints for querying and enumerating things like hosts, databases, services, etc.).
When we would pause and think about how we would extend this proof-of-concept into other, non-APM use-cases (which might have their own completely distinct ontology of the environment), it was abundantly clear that the approach we were taking would never provide holistic “Observability” beyond the confines of the narrow APM use-case we were hard-coding ourselves into.
The question for us became the following: how could we build a monitoring, troubleshooting, and analytics platform that could (a) accept a wide variety of diverse machine data from commodity data collectors (much like a general-purpose log or metrics management platform), and simultaneously (b) provide a variety of opinionated, purpose-driven, use-case specific workflows on top of those data (like you’d find in a first-class APM product). Reflecting on this challenge led us to introduce one of the key abstractions you see in the Observe product today, Resources.
In Part 2, we’ll dive deeper into Resources, and how this abstraction forms the foundation of our product.