Navigating a Market Downturn With Observability
You undoubtedly heard a lot last year about the impending doom of a market downturn, and the narrative hasn’t changed much as we embark on a new year. There’s still a lot of uncertainty about what the future holds and how long a market downturn might last. Regardless, the impact is already being felt across the tech world. There is a continuing surge in layoffs reported at startups and even large enterprises are recalculating. Few companies are truly recession-proof and analyst firm Gartner has already documented how the fears organizations have related to an economic downturn are shaping their risk assessments.
Your team probably had its hands full already, even before macroeconomic factors started tightening the belt buckle on companies across various industries. Whether your company has already been impacted, or you’re worried about potential impact, you’re probably thinking about how you and your team must cope with this new reality. The IT budget isn’t going to increase at the same rate as data growth, and now you have the risk of losing people while upholding the same quality of service. It’s a bleak picture, but doing nothing won’t address these challenges, and implementing observability can help reduce costs and complexity while positioning your organization for sustainable scaling.
Growing Challenges
There are a few expected real-world impacts on IT from the current economic climate. These challenges don’t exist in isolation and in actuality, compound one another.
- Stagnant or reduced budget. Some venture capital firms are slowing funding for the foreseeable future which forces startups to be more cautious, and larger companies are reining in spending to maximize profits. Your budget may not be increasing as a cost-saving measure, and even worse, it might be actively decreasing. However, your actual needs are likely unchanged and the adage of “do more with less” is more prominent than ever.
- Sacrificing tooling or capabilities. Reducing the budget allocated for new or even existing tools may necessitate sacrifices that impact your team’s ability to do the work they need to do. Before the emergence of modern observability platforms, vendors have sold a smorgasbord of monitoring, log analytics, and APM tooling which can tax the budget even if you have a good relationship with your primary vendor. If you’re forced to give up a tool or some functionality of one, then that can directly impact your ability to troubleshoot and prevent outages.
- Staffing cuts and fewer people doing more. Layoffs and hiring freezes are already happening across the tech world. If hiring is on hold, then the cavalry won’t be coming to help your team tackle its ever-growing backlist. Losing team members could mean an increase in work for those remaining and the loss of institutional knowledge which could make doing your current workload more difficult. Losing someone while also contending with tool sprawl can mean losing the expertise required to effectively operate a specific tool.
- Data growth won’t stop. Even if staffing cuts and reduced budgets weren’t factors, you’d likely still deal with an increased workload because data growth continues to scale at many organizations. Seagate and IDC have previously reported that enterprises can expect an increase in the annual growth rate of data to be 42%. Remember when we said the challenges can compound each other? Well, if having fewer people, fewer tools, and less budget sounds bad, a growing environment to manage adds another dash of pessimism to that mix.
- Customers expect the same quality of service, downturn or not. Your day-to-day may be getting harder but your customers have the same expectations for the service you provide, whether those customers are internal or external. In the case of external customers, your business has little appetite for churn in a time of economic uncertainty.
You Can’t Do Nothing. Do Observability.
Observability is a measure of how well the internal states of a system can be inferred from knowledge of its external outputs. Practically speaking that’s any time-stamped semi-structured data contained in the output. This is something to be achieved, not something you purchase outright. You may have seen one of the many “observability vs monitoring” posts published in the last three years, and suffice it to say observability is not monitoring, and achieving it can require some strategic planning for many organizations. That can sound daunting right now for the reasons listed above.
Expensive tools that require specific expertise to use and don’t deliver the results you need to prevent incidents from impacting customers are untenable, even in the best of times. If it took days to respond to incidents with your existing monitoring tools and staff, then consider what’ll happen if you have fewer tools and fewer responders. Observability is critical to addressing the challenges happening now and preventing them from scaling into even graver problems down the road.
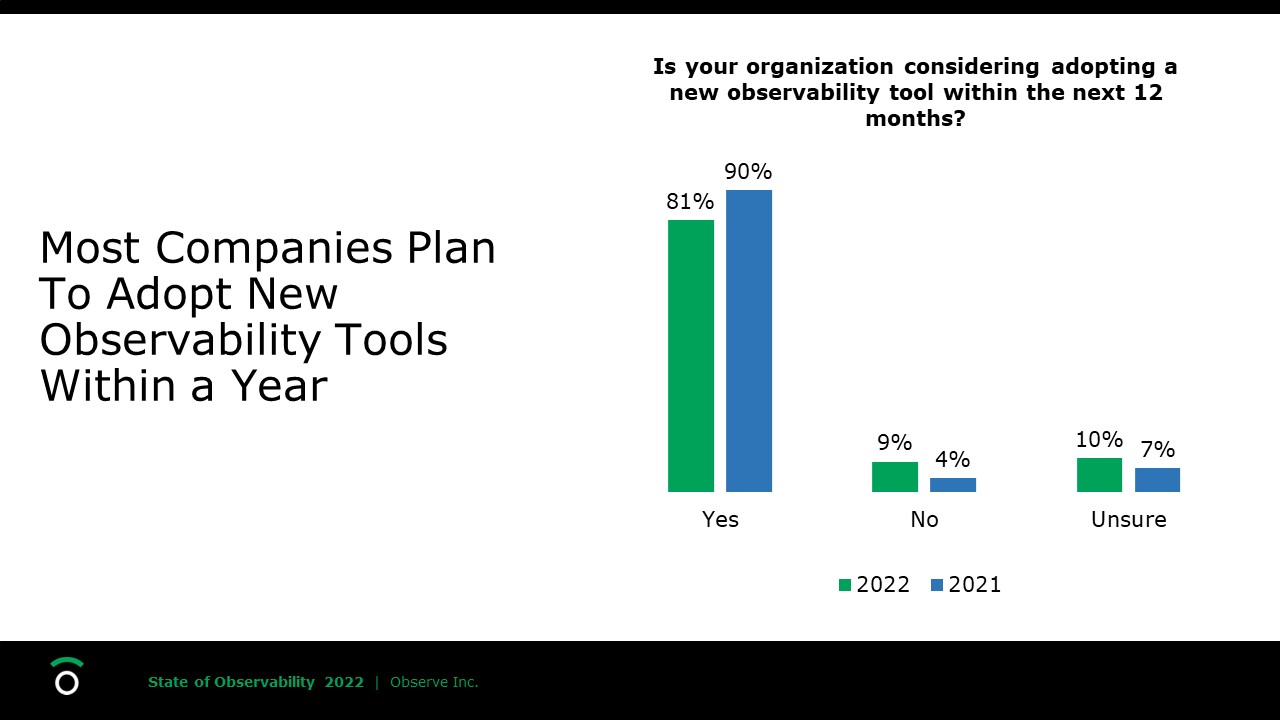
We ran an end-user study on the State of Observability in 2022 and found that 53% of organizations said Observability is a high priority and 81% of total orgs surveyed plan to adopt a new observability tool in the next 12 months. Whether new tooling is adopted remains to be seen, but the evidence is clear that needs are not met by current methods. If you’re among the companies that are early in their observability journey you may be thinking you’re better off putting the whole thing on hold right now and making do with what you have. However, doing nothing only makes things worse and there are some good reasons why you should invest in observability since it could help you mitigate some of the worst effects from the above challenges.

Reduce Complexity
Applications and infrastructure have gotten more complex thanks to mainstream hybrid and multi-cloud adoption as well as the adoption of cloud-native technologies such as Kubernetes and serverless. Consequently, the web of tools used to keep applications up and running has also gotten more complex. Fifty-seven percent of organizations have 6 or more monitoring tools in place across their company today. Aside from cost implications, this can result in data silos, less visibility into data, and ultimately slower mean time to resolution (MTTR). When it comes to investigating issues, 70% of orgs use 3 or more tools when troubleshooting.
Observability can also help you consolidate tooling. It’s become commonplace to have separate tools (and even separate vendors) for different data types such as logs, metrics, and traces. The ability to eliminate data silos and reduce the need to move between tools during investigations has clear benefits. A tool that can unite data types rather than separate them can also improve correlation to help keep data context intact.
It’s impossible to always know what data you need for an investigation later on, so it’s important that you can ask any question about your data without restrictions. Institutional knowledge can be a major factor in expediting an investigation, but if your team is used to relying on that then it’s a potential risk too. Having observability means democratizing your data to let more users query it and benefit from the context around the data without having to have a wealth of institutional knowledge.
Prioritize The Business Impact of Observability
We know data growth will continue, but if cost is already a pain point with your existing log management or monitoring tools, it’s likely to get worse. The risk is heightened by the fact that data is integral to observability, having less data, or less useful data can impact your ability to gain actionable insights. Legacy log management tooling has often adhered to ingest-based pricing models which means that more data coming in results in more dollars being spent – regardless of whether you use it or not.
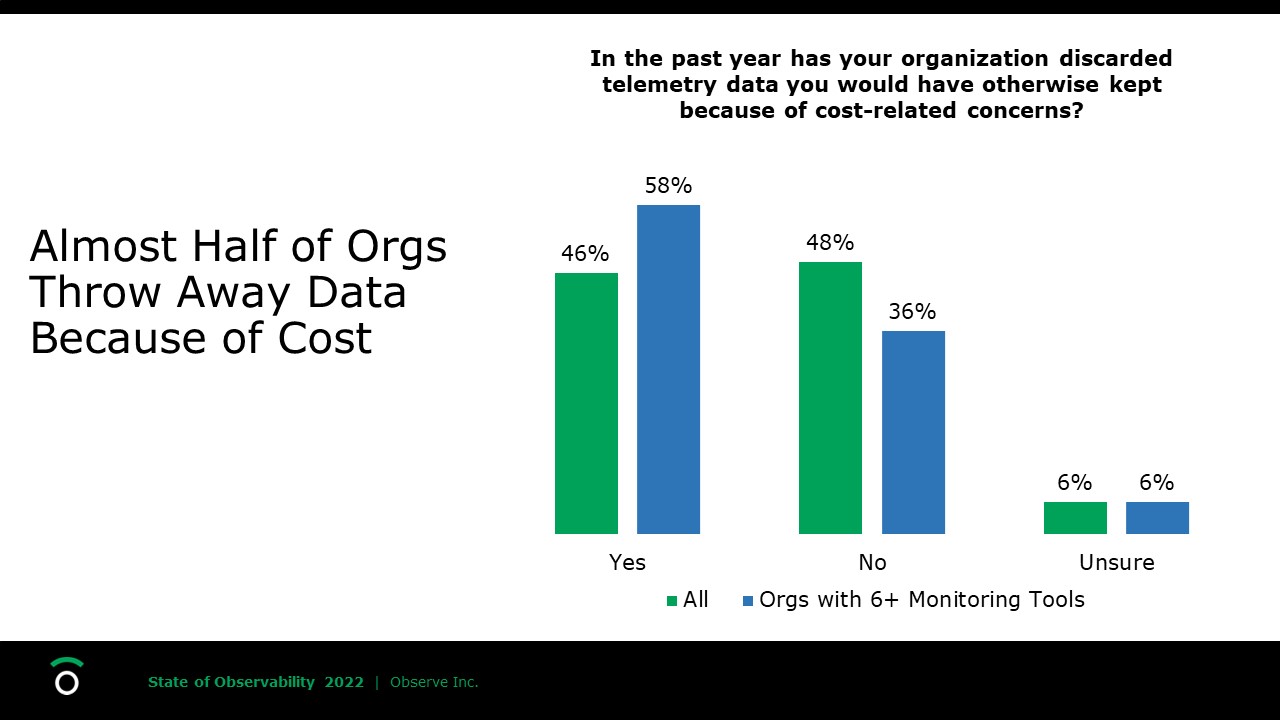
In Observe’s State of Observability report, 78% of organizations stated that they ingest more than 100GB of data into observability tools per day and 10% said they ingest more than a TB per day. We also saw that 46% of organizations threw away data they would have otherwise kept because of cost concerns. Observability can help users consolidate tooling for immediate cost savings, but also move users away from tools that aren’t architected for data growth.

How To Be Prepared for the Future
The term observability is in vogue and many vendors have quickly rebranded existing tooling to keep up with the times. Not every product labeled observability actually gets you to observability. You also shouldn’t have to purchase an entire ecosystem of tools from one vendor just to be able to use multiple data types. Organizations must look at tooling with an architecture that scales with their data growth. Here are some key factors to consider for your observability needs:
- Ability to ingest different types of data from many different sources. You need data of all kinds including logs, metrics, traces, and beyond. To be well positioned for the future you need to be able to ingest whatever data type you need from any source. The ecosystem of open-source data collectors has grown dramatically including popular collectors such as Fluentd and OpenTelemetry. Once you have the means to collect necessary data from relevant sources, you can bring that data together to fuel a variety of use cases.
- Correlation of data. Observability needs data, but more data is only useful if it results in insights that can be used in real-time to achieve faster mean time to resolution. Silos between tools or data types can make it harder to relate that data and harder to get useful information from it. You need tooling that can provide context for data and make your environment easier for users to parse, not more complex. This requires a new architecture from what we’ve seen in the past where different data types are inherently siloed. That’s why Observe’s designed the Observability Cloud.
- Pricing that scales. If cost scales linearly with the amount of data ingested and hosts used, it’s probably better for your vendor than your budget. Pricing that aligns with your data usage ensures that your costs are related to the value you get from the tooling and not just scaling by default as your business grows. That’s one reason why Observe uses Snowflake, it allows us to separate compute and storage and bill based on usage.
- Longer data retention. If keeping your data longer means paying more to archive and rehydrate it later then you are incentivized not to keep it around. Not all telemetry data needs to be kept for months or years, but security and compliance requirements may dictate that you keep data for a year or longer.
- Time to value. In terms of saving time, you should avoid tooling that requires lots of instrumentation and setup before you can start using data. In the aforementioned survey, “instrumentation of code” was the fastest-growing challenge to observability between 2021 and 2022. Not to mention that you want to get data from multiple sources and instrumenting code to the needs of a single vendor is a hindrance. Since sprawling environments using myriad cloud services from multiple public cloud providers are common, time spent instrumenting can compound.
- Abstraction, where it counts. With fewer people on hand to manage more data, it also shouldn’t mean you have fewer people on hand to manage the growth of your observability tool. If a tool is PaaS under a SaaS veneer then you will spend time managing infrastructure related to your observability tooling, which is another scaling bottleneck and drains your team’s time.
If you’re ready to advance your observability journey and get the tools your organization needs to reduce MTTR and reduce costs then click here to get started.

