Microservices Logging and Troubleshooting with Observability
Introduction
Unless you’re still living in the era of Windows XP, you’ve probably heard of microservices — the latest and greatest way to design application architectures. By breaking complex applications into smaller parts, microservices can deliver benefits such as faster development, greater resiliency, faster deployments, and more manageable codebases.
Although microservices offer some crucial benefits, they also present some unique challenges. Microservices architectures are more complex than those of monolithic applications. They also typically involve management tooling, like Kubernetes, that normally does not factor into monolithic software stacks.
The following pages walk through what microservices are and explain how they’re different from monolithic apps. You’ll also learn which types of metrics and logs microservices produce and how teams can extend conventional monitoring and logging strategies — meaning those designed for monolithic apps — to achieve microservices observability.
Whether microservices are just a buzzword you’ve heard about but haven’t explored personally, or you’re already knee-deep in containerized, distributed environments, this eBook will help ensure that performance and availability issues with microservices don’t undercut the scalability, agility, and resiliency advantages that microservices stand to offer.

Microservices 101
Let’s start by defining the core concepts at the root of microservices.
What is a microservice?
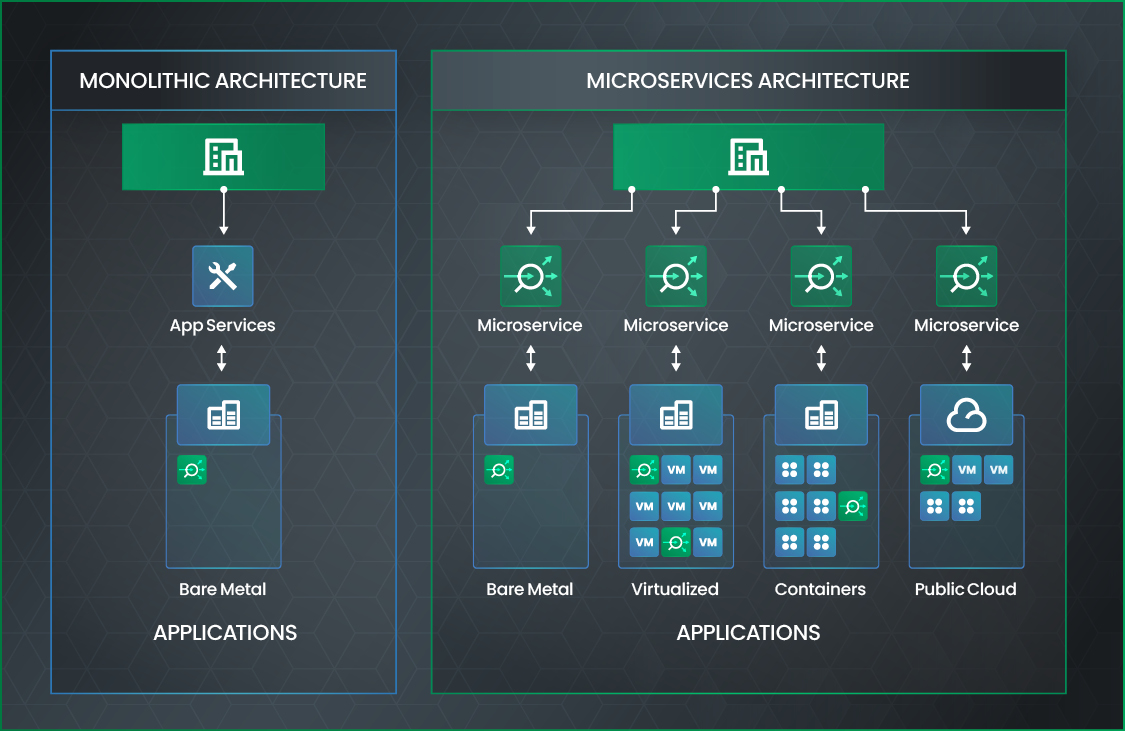
A microservice is software that performs a certain function within a larger application. By combining multiple microservices, developers can build complete applications based on a modular architecture. They can also deploy the microservices across a distributed environment where each service runs independently from the others, yet is in constant communication with them.
For instance, a microservices-based application may include one microservice that manages the UI, another that handles user authentication, and another that communicates with the backend database. There are no hard-and-fast rules regarding how microservices are designed or exactly which types of functionality each one can host. Microservices are an architectural concept that developers can implement in a variety of ways.
All microservices share the defining characteristic of breaking application functionality out into smaller units. In this regard, microservices are the opposite of conventional, “monolithic” applications, which typically package all application functionality into a single process and codebase.
The origins of microservices
It wasn’t until the 2010s that microservices as we know them today first appeared. However, the roots of microservices stretch back further.
In the 2000s, enterprises experimented with the concept of a Service Oriented Architecture, or SOA. SOA divided application functionality into discrete units, usually based on business use cases, that could be reused across the organization. For example, a business might create one service to look up customer account information and another to process payments. This would allow multiple departments to use the same services to build other applications.
If you want to reap the benefits of microservices, you must prepare to manage their complexities. While the logging, monitoring, and troubleshooting strategies that work for monoliths may be a starting point for managing microservices environments, teams need to up their game when working with microservices apps.
Unlike microservices, SOA focused on mapping application functionality to business functionality, rather than breaking individual applications into discrete services. The services in an SOA architecture were also usually larger and less nimble than microservices.
Going further back in time, concepts like microkernels, which were all the rage in the late 1970s and 1980s, also anticipated microservices. Microkernels attempted to break operating system kernels into small, discrete processes — which never fully caught on. That is why all of the mainstream operating systems in use today use monolithic kernel architectures.
Whereas trends like SOA and microkernels enjoyed limited success, microservices have entered into widespread use today. More than three-quarters of businesses were using microservices for at least some of their applications as of 2020, according to O’Reilly.
Benefits of microservices
The popularity of microservices stems from several factors.

Because microservices break application functionality into discrete units, they eliminate single points of failure. In a monolith, a problem anywhere in your app may crash your whole app. But with microservices, the failure of just one microservice won’t typically bring down the entire application.
Microservices also offer the advantage of faster and simpler deployments. Because each microservice typically includes a relatively small amount of code, it is easier to test and deploy a microservice than it is an entire app.
If a microservice fails, it can be rolled back more quickly and easily — and with fewer disruptions to users — than a monolith.
Finally, since microservices can scale independently, they provide the foundation for a more agile and efficient application. If you need to support a spike in user authentication requests, for example, you can add instances of the microservice that handles authentications, without having to scale up the entire application.
How are microservices deployed?
There are also no universal rules that shape the way developers deploy microservices. Multiple approaches exist.
The most common microservices deployment method involves running each microservice inside a container and using an orchestration platform, such as Kubernetes, to manage the microservices as a complete application.
However, you could also deploy microservices inside serverless functions or (if you want to be truly cutting-edge) unikernels. There is also nothing to stop you from deploying a microservice inside a virtual machine, or just deploying each microservice as an independent process directly on a bare-metal server. That said, the latter approaches are not typical. VMs take longer to start, which makes them a less agile deployment solution for microservices. Also, microservices on bare metal lack isolation from each other, which could create security issues.
What makes microservices complex?
The simple explanation for why microservices are so complex — and difficult to observe and troubleshoot — is that microservices introduce more moving parts to the application. In addition, each part is updated more frequently. With more parts and more change comes more complexity, not to mention more data that developers and operations teams need to sort through when troubleshooting issues.
The longer explanation is that a microservices application generates many more logs and metrics at both the application level and the environment level.
Instead of logging data just to one file, as a monolith would, microservices produce multiple logs — one for each service. To observe microservices effectively, you need to collect metrics from each microservice, rather than simply monitoring the application as a whole.
Microservices are more complex because they typically involve more layers of infrastructure and larger, less centralized environments. On the other hand, monoliths are usually deployed on a single server. Microservice deployments typically leverage a cluster of servers, which are managed by an orchestration platform like Kubernetes. What’s more, because microservices are updated continuously, they create highly dynamic, ephemeral environments. That means that you have to observe each server in the cluster, as well as the various components of Kubernetes, to keep your application humming smoothly.
Logs and metrics for microservices
Now that we know how microservices work at an architectural level, let’s delve into the question that developers, IT operations teams, and SREs are dying to answer: How to work with microservices logs and metrics.
How microservice logging works
Just as microservices are designed and deployed in multiple ways, they also generate logs in many different ways.

If you deploy a microservice inside a container, the microservice will usually store log data by default directly inside the container. That may seem straightforward, but because log data disappears when the container shuts down, you’ll need to ship your logs to persistent storage while the container is still running.
There are various methods for doing this — like running a “sidecar” container to aggregate logs from other containers — or adding custom code to your application so that it writes log data to an external location by default. However, each of these approaches complicates the architecture of your environment.
Logging for microservices deployed via serverless functions can vary depending on the serverless platform you use. Most public cloud serverless offerings (like AWS Lambda) collect log data from functions using the clouds’ native logging services (like AWS CloudWatch).
And if you deploy microservices in a unikernel, VM, or directly on bare metal, the logging process will depend on the way that you configure the application code or environment to handle log data.
Centralizing microservices logging
This means that there is no single way in which microservices generate log data, nor is there a common location where logs are stored. To centralize your logs, you need to tailor your approach to the type of microservice environment and deployment method you are working with.
For example, here are the approaches you may take to centralizing logs in two popular environments for hosting microservices: Kubernetes and AWS.
Kubernetes microservices logging
Kubernetes provides no native functionality for collecting or centralizing application logs, so you need to manage logs yourself using a third-party tool that’s able to collect logs from containers.
As noted above, there are multiple possible methods for container log collection. You could modify your microservice code to ship logs directly to a log aggregation and analysis platform, although that approach requires a lot of development effort.
Another option is to deploy an agent inside Kubernetes that will collect logs from your various containers and ship them to an observability platform. For example, you can deploy the Observe agent to Kubernetes with a single kubectl command. Then, Observe will collect logs from all of your containers and help you analyze them. Observe also provides an interface that makes it easy to drill down into individual logs while also monitoring the performance of the environment as a whole.
AWS microservices logging
For workloads running in AWS, you can collect and centralize logs using AWS’s native monitoring tools. However, this approach may leave you with siloed data. It can also make it difficult to correlate information from outside of AWS, such as customer support systems, with logs from microservices-based applications deployed in AWS.
An alternative approach is to use a third-party tool like Observe, which can collect data from any AWS service, aggregate it and correlate it with other data sources to provide more actionable insights about the state of your microservices.
Microservices metrics basics
Logs are only one source of observability data for microservices. Metrics are equally important.
Two main factors make it more difficult to collect and analyze metrics for microservices:
- More metrics sources: Instead of collecting just one set of metrics for the application and infrastructure, you need to collect metrics for each microservice, as well as the container or pod that hosts it. On top of this, you may need to track metrics from each node in your cluster, as well as from the various components of your orchestrator.
- Metrics correlation: Metric analysis for individual microservices can be difficult as the root cause for an anomaly in one microservice’s metrics may lie in another microservice. For example, a microservice that handles the UI could process requests slowly due to an issue with an authentication microservice.
Both of these challenges are solvable, but only with more effort than teams would need to invest when managing metrics for monoliths.
Metrics strategies: RED vs. USE
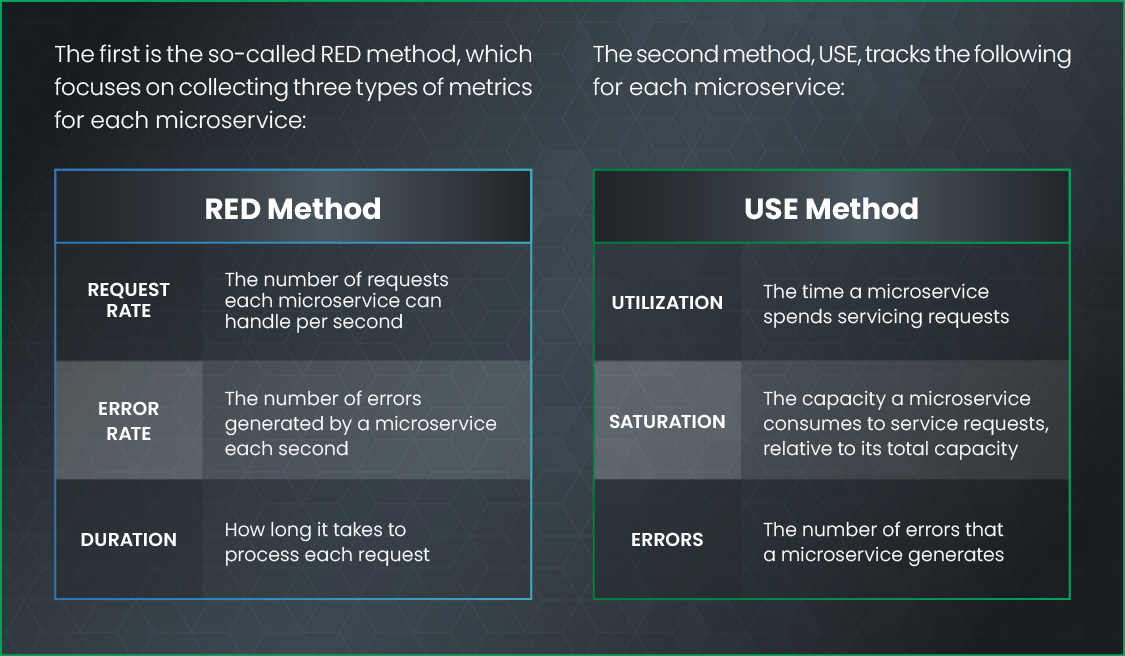
Typically, teams turn to one of two approaches for working with metrics from microservices applications.
There are some important differences between each of these methods. In general, the RED method is simpler to work with, because it doesn’t require calculating information like the total service capacity of each microservice — which may fluctuate over time. On the other hand, the USE method may deliver insights that are more immediately actionable because it makes it clearer when a microservice is close to exhausting its total capacity.
On the whole, both methods provide a similar level of observability. They each help teams establish a baseline for the expected behavior of each microservice. They then help detect anomalies that could be signs of a problem.
Thinking beyond RED and USE: Correlating data
However, the USE and RED methods are not enough on their own to observe and troubleshoot largescale microservice-based applications. You have to go further if you want to understand how the performance of individual microservices impacts the performance of your application as a whole.

To do this, you must be able to correlate metrics and logs from each microservice with the same data points from other microservices to pinpoint the root cause of performance issues.
You must also be able to analyze data from outside your microservices, and use it to contextualize microservices behavior. For example, you can use logs from your CI/CD pipeline to determine which code change for a microservice triggered a performance issue in that microservice. You could also analyze data from your customer support system to associate an uptick in support requests with a performance issue that may originate from a microservice.
Troubleshooting microservices with Observe
To stay on top of microservices performance and troubleshoot issues rapidly, you need a data collection, aggregation, and analysis strategy that lets you ingest as much data as possible about your microservices. You must also be able to correlate it all in a way that highlights what needs fixing within your complex, distributed environment.
With support for more than 250 integrations, Observe can collect data from any microservice running in any type of environment — Kubernetes, AWS Lambda, VMs, and even bare metal. Then, using Observe’s GraphLink feature, you can trace dependencies and interactions between microservices to gain granular insight into your application.
No matter which approach you take to building a microservices environment, Observe gives you the observability you need to ensure that microservices are an asset, not a liability.
