AWS Observability Overview
Introduction
Building an observability strategy for Amazon Web Services (AWS) is like drawing a picture: It’s easy to do. It’s hard to do well.
Just as anyone can scribble on paper with a crayon and call it a work of art, any engineer can launch AWS CloudWatch, configure some alarms and declare “observability mission accomplished!”
But an observability strategy based solely on tools like CloudWatch would be worth about as much as an amateur stick-figure sketch. It would provide only partial visibility into what is happening in your AWS cloud environment. It would leave you guessing about the health of applications and services running on top of AWS infrastructure, as opposed to the infrastructure itself. It would offer little insight into how the state of your AWS resources has changed over time.
If you’re wondering what it takes to create an AWS observability strategy that actually works, this eBook is for you. The following pages explain where many teams go wrong when approaching AWS observability, what the risks of an incomplete solution are, and how to design an observability stack that delivers complete, actionable coverage for everything running in an AWS environment.
Why people do AWS observability wrong
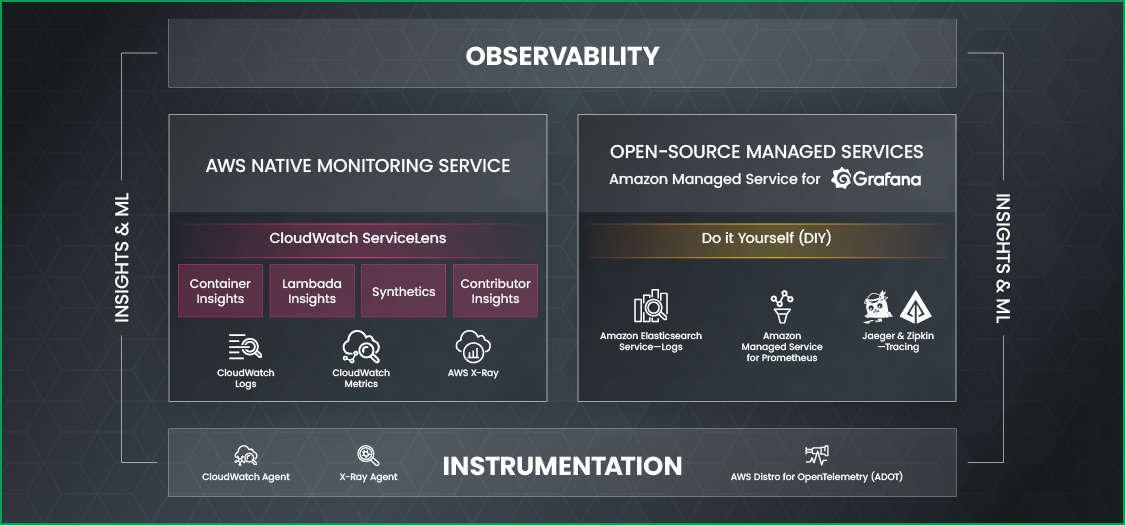
At first glance, constructing an observability stack for AWS can seem misleadingly simple. After all, AWS offers not one but several native tools for collecting and analyzing data from AWS services. There are CloudWatch and CloudTrail, AWS’s main monitoring solutions. There’s Kinesis Firehose, a basic data collection service, and EventBridge, a fancier data collection service. You can even launch a complete ELK stack natively on AWS for analyzing your environment if you want to.

Given all these native, easy-to-deploy AWS tools for monitoring and analyzing AWS services, many teams fall victim to the temptation of building an observability strategy that attempts to weave some combination of these solutions together to maintain visibility into an AWS environment. Their approach may work well enough if they are using just a handful of services and need only very basic observability for them.
But for an AWS environment of any complexity, an observability strategy rooted in AWS monitoring tools alone falls far short of delivering the actionable insights that teams need to optimize AWS reliability and performance. Here’s why.
Disparate, disconnected monitoring tools
Although AWS offers a lineup of native tools for monitoring its services, it provides relatively disjointed solutions that are difficult to integrate. AWS provides tools for collecting data from individual services, but it offers no cohesive strategy for aggregating and querying that data beyond the simple visualizations and alerts available in tools like CloudWatch.
What this means is that it’s very difficult to gain an end-to-end understanding of the state of your cloud environment as a whole using AWS tools alone. Solutions like CloudWatch may work if you just want to track EC2 metrics, for example. But if you need to understand how the performance of your EC2 instances, Lambda functions, S3 storage buckets, and ELB load balancers fit together, you won’t get very far with CloudWatch.
Focus on infrastructure
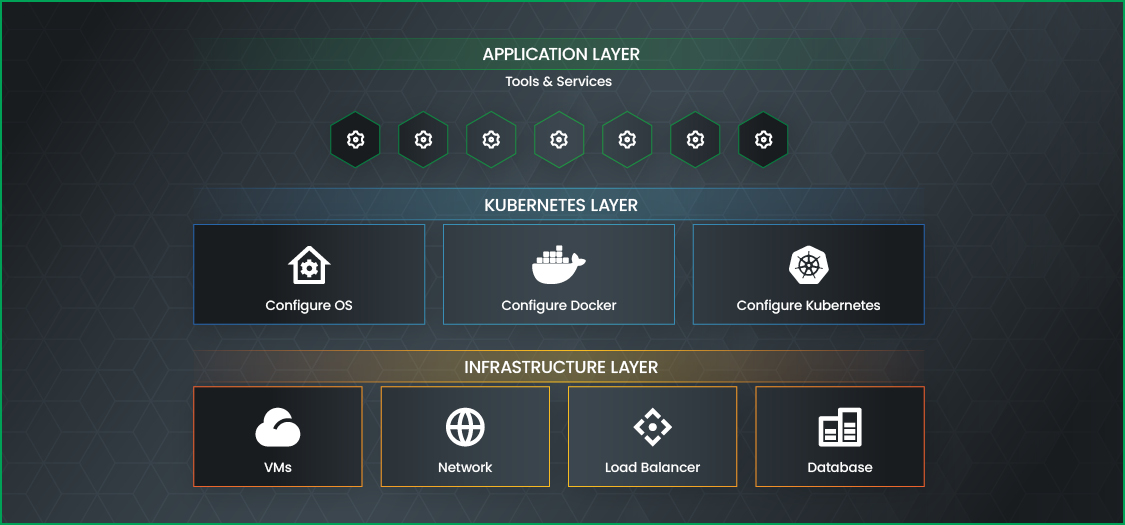
A second key limitation of most of AWS’s own monitoring tools is that they focus on AWS services themselves, not what runs on top of them.
In other words, AWS gives you tools to collect data from EC2 virtual machines, Lambdas, and so on. But it offers little in the way of solutions for monitoring and analyzing the workloads running in your virtual machines or Lambda functions. Figuring out how to track the health and performance of a Kubernetes cluster and applications hosted on EC2, or of a microservice running in a Lambda function, is an exercise that AWS leaves to the customer — and it doesn’t provide tools to make it easy.

Varying data types and formats
Even if you did care only about monitoring AWS infrastructure, the fact that different AWS services expose different types of metrics and store them in different ways makes even simple AWS service monitoring challenging.
Most logs and metrics for AWS services go to CloudWatch, but there are plenty of exceptions. S3 access logs are stored in S3 by default. You can collect metrics for some SaaS applications using Kinesis Firehose, but it’s up to you to figure out what to do with them from there.
Likewise, log formats can vary across the AWS cloud, and AWS itself does little to help you make them consistent. Unless you aggregate and transform log data yourself, it’s hard to work with it in a standardized way.
You can try to manage this complexity using tags, which help you keep track of which types of data live where. But tags are a mess to manage at scale. Frankly, most engineers have better things to do with their time than meticulously tagging every AWS resource just so they can monitor it.
The bottom line: If you rely solely on AWS’s monitoring tools, you end up with a hodgepodge of different data types and formats spread across different locations. That’s hardly the foundation for an efficient observability strategy.
Minimal data analytics
Last but not least, AWS’s native tools provide limited data analytics functionality. Solutions like CloudWatch offer visualizations for individual AWS services, but they do almost nothing to help you correlate different metrics sources and analyze them collectively. Services like Kinesis Firehose allow you to collect metrics and forward them to a location of your choice, but it’s on you to figure out how to analyze them once they are there.
Of course, you can run services like the AWS ELK stack or Athena to provide analytics functionality. But you have to configure these services yourself to provide the insights you need. Apart from being easy to deploy within the AWS cloud, these services are hardly a turnkey analytics solution for AWS observability.
Essential ingredients in AWS observability
Now that we know how not to approach observability in AWS, let’s take a look at what an AWS observability strategy should provide.

Data collection from any service or workload
First and foremost, complete AWS observability requires the ability to collect data from any AWS service, as well as any application or other workload running on top of it. No matter how the data is formatted or where AWS stores it by default, it should be easy to ingest it into a centralized observability tool.
Data correlation
Collecting data is only half the observability battle (if that). The real value comes from correlating multiple data sources together to understand the total state of your AWS environment. Effective AWS observability entails the ability to map relationships between all of the services and workloads running in your cloud and understand how they impact overall performance.
Integration with external data
Even if all of your primary workloads run in AWS, you very likely have some resources or tools that run externally. You may have a CI/CD pipeline that deploys to AWS but is hosted elsewhere. Or, you may have a ticketing system that helps you support applications hosted in AWS, but that does not itself run in AWS.
Complete observability requires the correlation of these outside data sources with data from AWS. You need to know how ticketing requests relate to Lambda performance trends, or how application deployment frequency impacts EC2 resource utilization.
Track historical state
Sometimes you need to know what happened within your AWS environment in the past, and how it relates to performance in the past. Your AWS observability tools should provide the option of reconstructing the historical state of your environment and tracking performance trends over time.
Analyze, don’t just monitor
AWS observability is not about just monitoring what happens, but also about using analytics to understand why it happened, and what its impact was. This is why you need to be able to shape and link together data from every resource and analyze it collectively—while at the same time retaining the ability to drill down into the behavior of individual services or applications when necessary.
Simple data ingestion
Finally, ingesting data into AWS observability tools shouldn’t be a nightmare. You should be able to set up straightforward data collectors that efficiently move data in real-time into your analytics tools. In other words, you should be able to focus on understanding your observability data, not on collecting and managing it.
Observe’s approach to AWS observability
The Observe platform delivers visibility into AWS services and workloads that AWS’s monitoring tools don’t offer on their own. With Observe, you get:
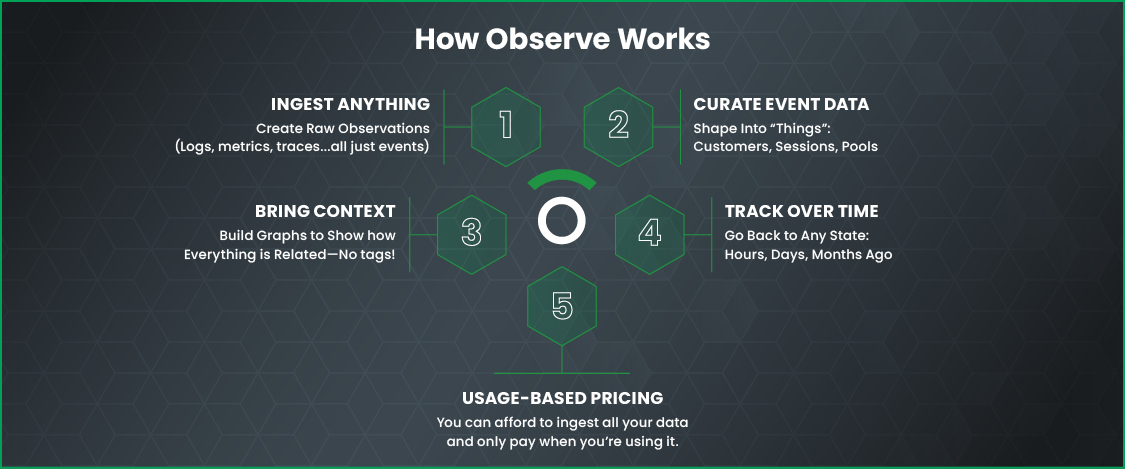
- Simple data ingestion from any source: Using either a Lambda function or Kinesis Firehose (your choice), you can ingest any type of data from any AWS service or workload into Observe. No more hunting down far-flung data sources and streaming them to multiple monitoring tools. And no work ingesting them or linking them together: Simply connect your data, and Observe lights up.
- Data shaping and correlation: Observe automatically links together all of your AWS monitoring data, as well as data from external services or resources, to provide complete context when you are troubleshooting issues. No more guessing about how trends compare or relate.
- Observe infrastructure and applications at once: Observe can interpret the health and performance of applications and infrastructure equally well. Whether you need to track EC2 instances, Kubernetes pods and the software running in them, or a SaaS application, Observe lets you do it in a centralized fashion by tracking metrics and traces from across all layers of your infrastructure and all services running on them.
- Track state over time: With Observe, you can track all of your resources and determine their state at any point in time. Need to know when an IAM rule changed and who changed it? Or which versions of an application were deployed when? Or how the state of your EC2 instances changed over time in response to autoscaling policies? Observe makes it easy to do all of the above and much more when investigating change over time.
- Usage-based pricing: Under Observe’s pricing model, you pay when you analyze data. You don’t pay exorbitant fees for data ingestion, and your data storage costs only as much as S3.
In short, Observe provides AWS observability that extends far beyond what is possible using AWS tooling alone. Instead of juggling multiple AWS tools, trying to link data sources together manually, and monitoring infrastructure and services separately, you can leverage Observe to gain deep visibility into your entire AWS environment—not to mention anything linked to it—and track the performance, reliability, and cost of all of your resources.
Download a pdf of this article here.