What’s New: PostgreSQL App!
With Observe’s new PostgreSQL App, you can now bring turnkey observability to all of your Postgres databases — whether on-premises or in the cloud — ensuring smooth operation and optimal performance.
Introducing the PostgreSQL App!
We are thrilled to introduce our latest addition to the Observe App family — the PostgreSQL App!
Designed to take the guesswork out of observing your PostgreSQL databases, this App comes packed with a wealth of features, including pre-built Dashboards, Datasets, and Monitor templates. Together, this out-of-the-box content provides you with all the insights to answer questions like, “Is my overall database query performance healthy?”, “Are there high latency or error rates?” or “Are my Postgres databases at, or near their connection limit?”
But the real magic unfolds when you connect it with other data sources within the Observe ecosystem. By linking PostgreSQL data with information from other Apps — like AWS, Kubernetes, and OpenTelemetry — you can gain a comprehensive understanding of your systems, bridging the gap between your database instances and other observability data for a more holistic view of your infrastructure.
Now that we’ve covered the highlights, it’s time to dive in and see what the PostgreSQL App can do for you!
What’s Included?
PostgreSQL, often referred to simply as “Postgres,” is a widely adopted open-source object-relational database (ORDBMS). It is fully SQL-compliant and is known for its reliability, robust feature set, and exceptional performance. It has become a popular database choice for many production environments — including some of our own Postgres databases in Amazon Aurora. All major cloud providers offer PostgreSQL as a service, further solidifying its position as a go-to solution for database management.

With Observe’s new PostgreSQL App, you can now bring turnkey observability to all of your Postgres databases — whether on-premises or in the cloud — ensuring smooth operation and optimal performance.
Let’s further explore what content this App contains and the many questions it can help you answer.
Dashboards
The PostgreSQL App includes seven Dashboards that equip you with all the necessary metrics to effectively troubleshoot and understand the overall health of your PostgreSQL instances. Let’s look at the included Dashboards.
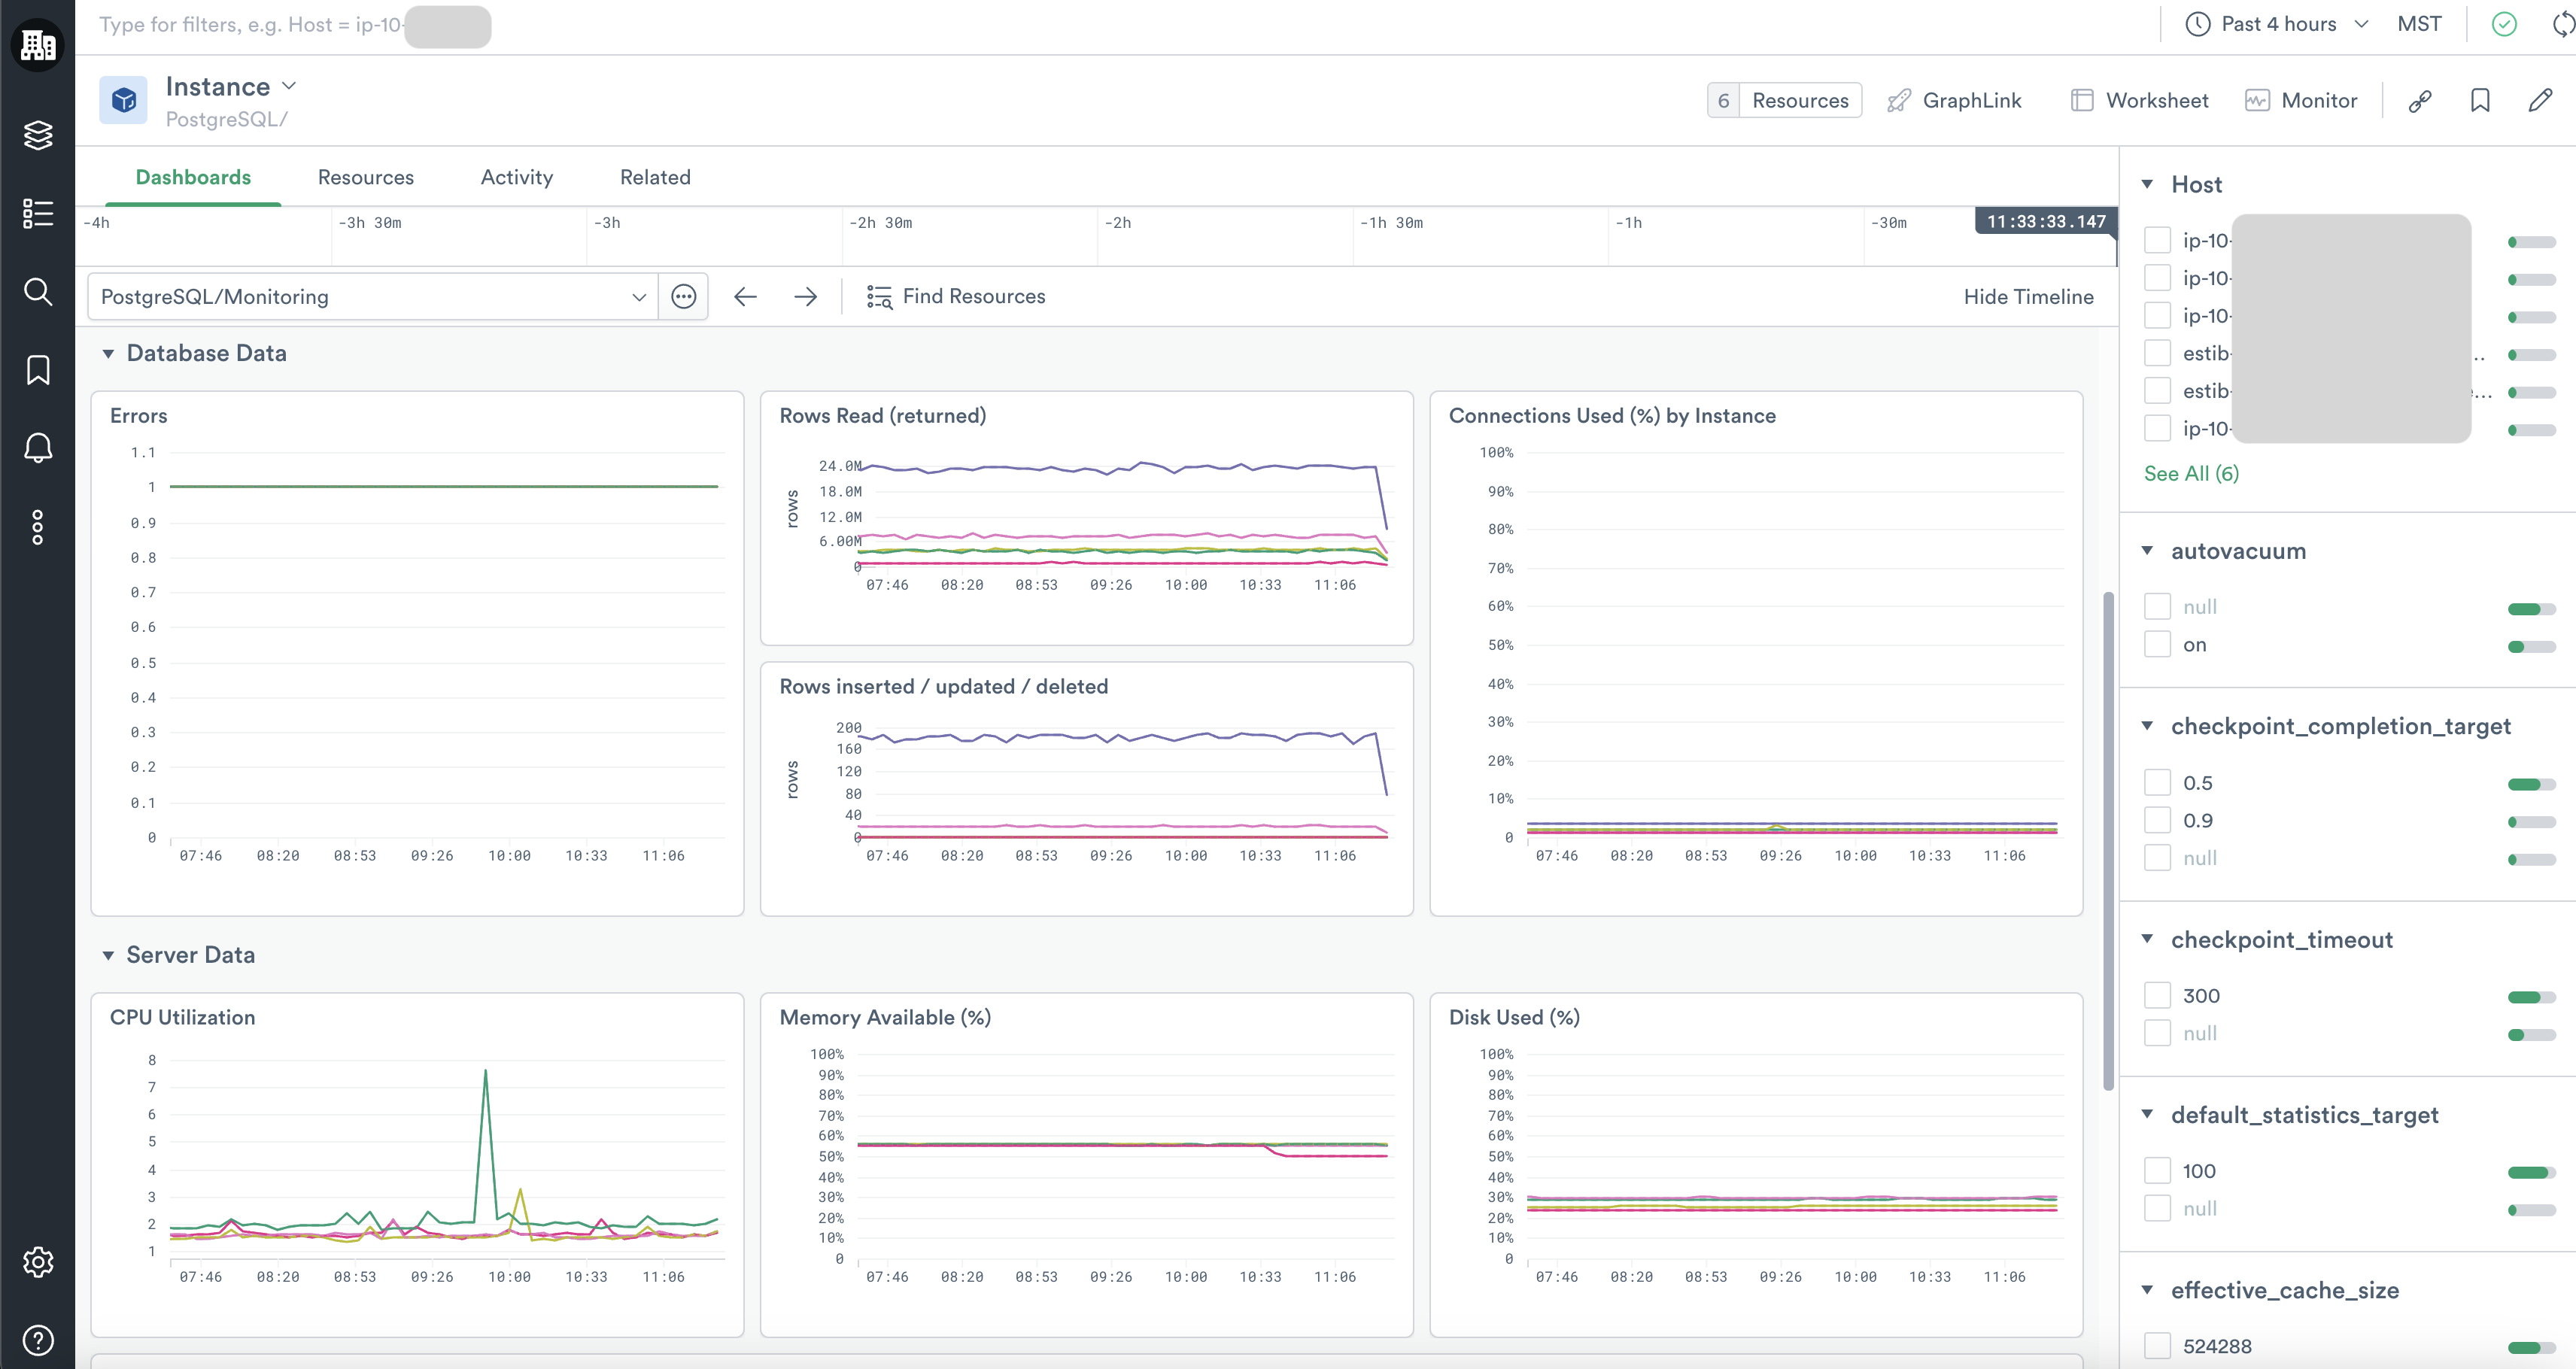
The Monitoring Dashboard (below) is a great starting point for investigations as it offers a quick glance at key health metrics for your PostgreSQL DB instances, including summaries of errors, throughput, connection availability, and server resource consumption.

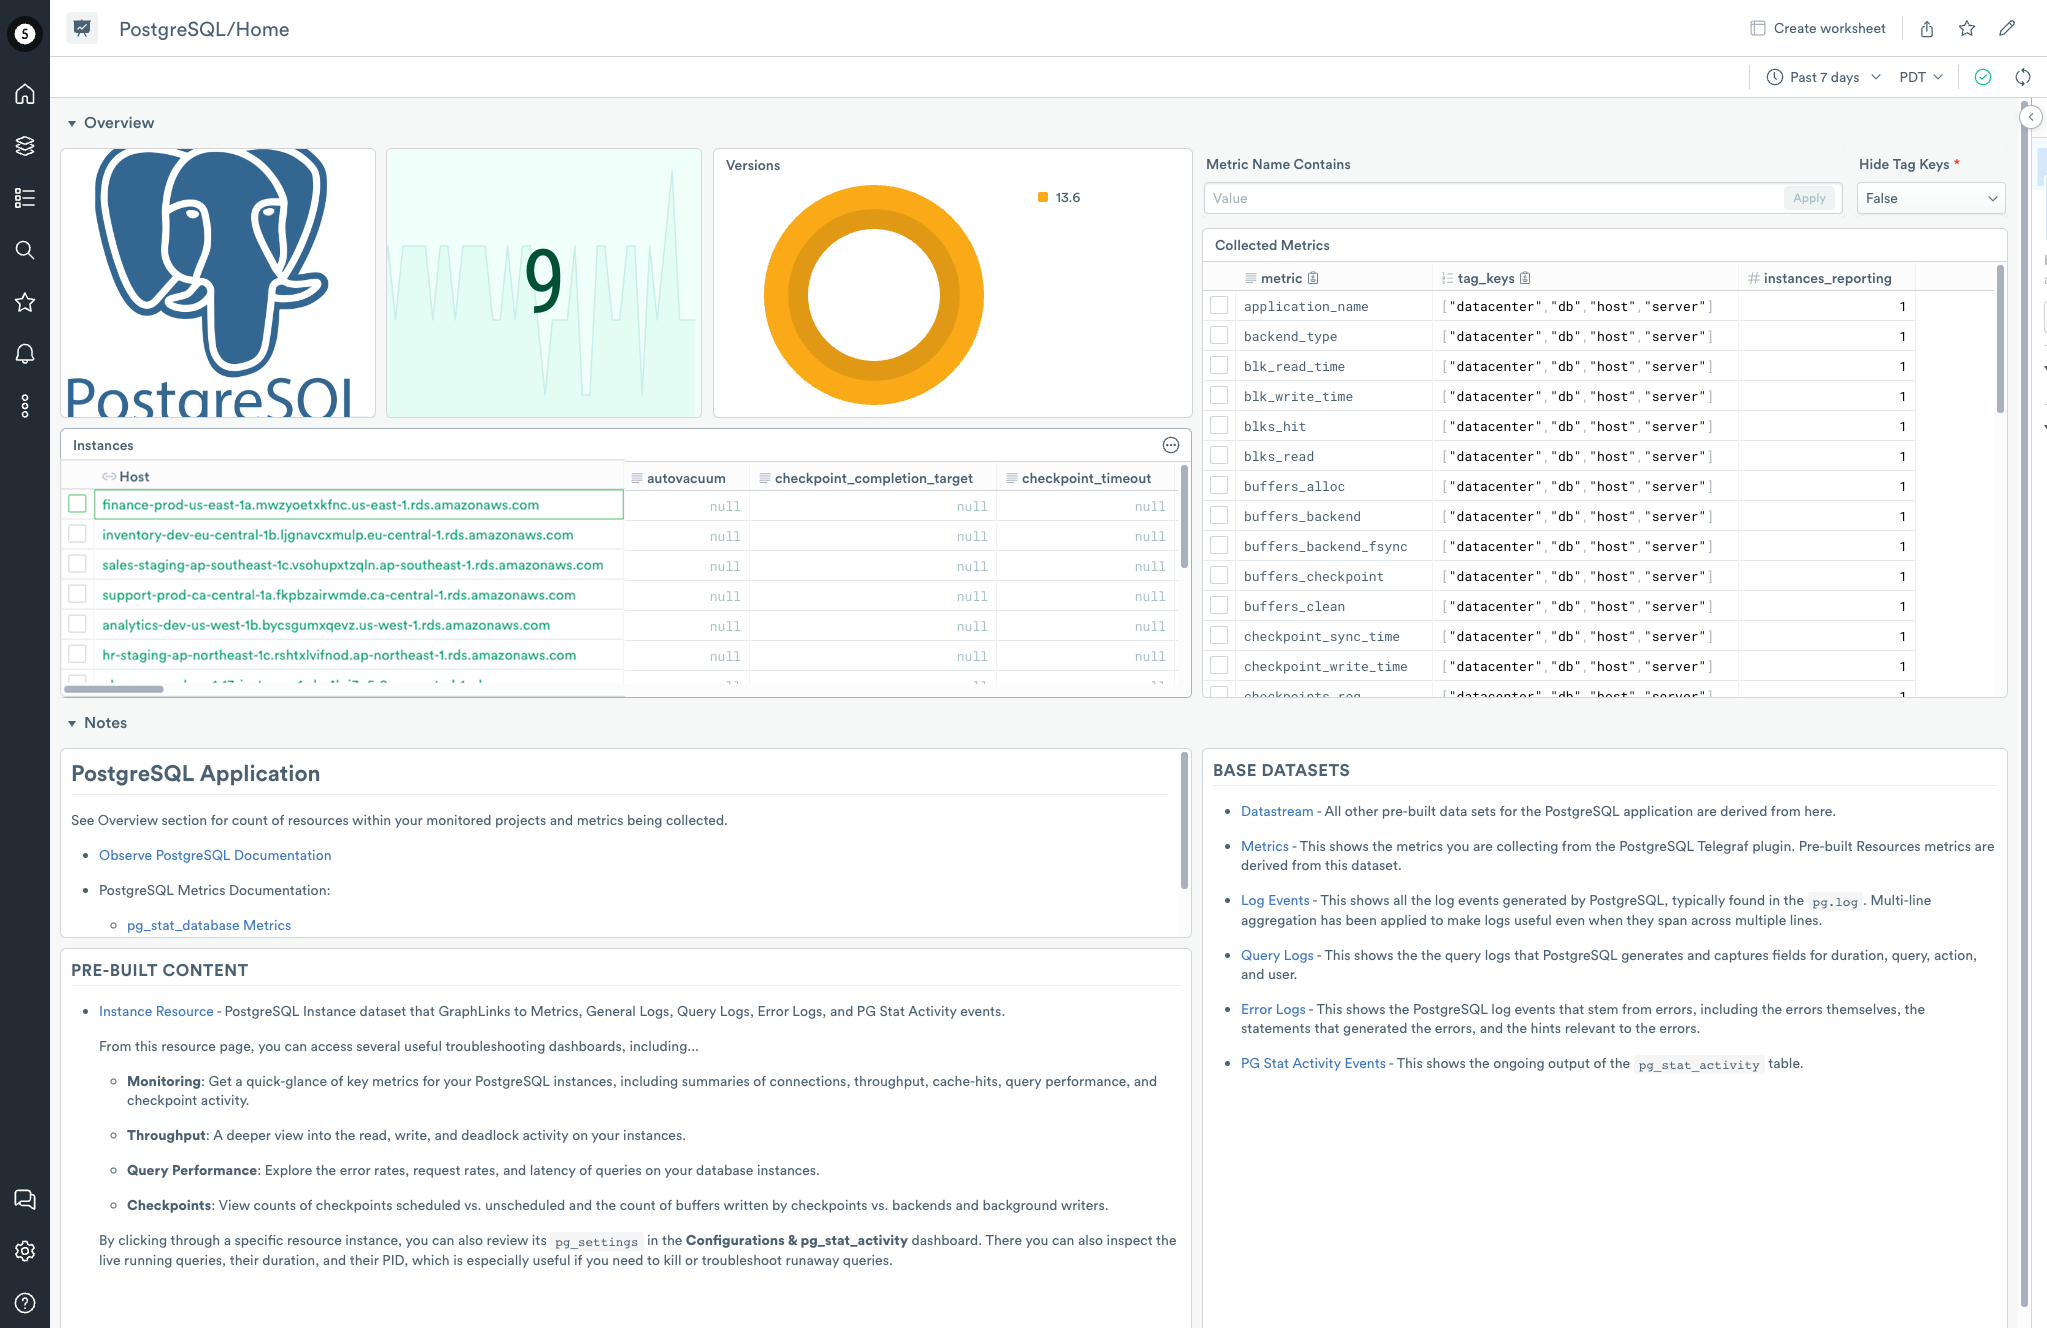
Our PostgreSQL App also includes other Dashboards, such as Checkpoints, Performance, Query Performance, and Throughput Dashboards, to help you further examine specific metrics when more detail is required. Additionally, the Configurations & pg_stat_activity Dashboard allows you to review the configuration settings and current activity of your database instances without needing to log in to the server or the admin console.
Datasets
The PostgreSQL App also utilizes open-source plugins such as Telegraf and FluentBit to collect essential logs and metrics from PostgreSQL instances and transform them into Datasets. These Datasets serve as the foundation for the Dashboards and offer the raw metrics, logs, and event data necessary for advanced troubleshooting, helping you uncover hidden connections in your data.

The PostgreSQL App features seven Datasets to enable deeper analysis — Error Logs, Query Logs, and Log Events Datasets comprise all pertinent log data, while the Metrics Dataset provides raw metrics. The Instance Resource Dataset allows you to select individual instances and see detailed resource utilization information, and the PG Stat Activity Events Dataset reveals real-time insights into your instances’ workload and performance.
Monitor Templates
The PostgreSQL App also features six pre-configured Monitor templates that provide crucial alerts on the most widely monitored metrics to help you identify and address potential performance problems and ensure optimal database health and reliability.

The Connections (% Used High) Monitor template alerts you when the percentage of used connections reaches a critical threshold, enabling you to tackle any connection-related issues that could impact the smooth operation of your databases. The Error Count Increase Monitor template keeps track of the error count in your PostgreSQL instances and notifies you when there is a significant increase, allowing you to promptly investigate and resolve any issues that may have caused the spike.
And with four different Monitor templates to help you keep an eye on throughput, you’ll be alerted to significant changes in row operations, helping identify dead rows, potential locks, query performance issues, and spikes in database activity or bottlenecks.
Lastly, you can build your own Monitor templates with the many metrics provided by the PostgreSQL App to alert on virtually any condition imaginable, allowing for unparalleled customization and comprehensive monitoring of your databases.
What Can You Do With This App?
The PostgreSQL App allows you to swiftly address a wide range of questions related to your database instances, such as identifying performance bottlenecks, spotting anomalies in resource utilization, or uncovering issues with query execution. Besides using the pre-loaded content straight out of the box, you can further tailor it to your unique needs by creating your own customized Dashboards and Monitor templates using the Datasets and metrics found in this integration.
Whether you use the default content found in the App or create your own, let’s look at a few common questions the PostgreSQL App can help you answer to keep your databases running smoothly and efficiently.
- Are there any anomalies or trends in the PG Stat Activity Events Dataset that could indicate issues with the workload or performance of my PostgreSQL instances, such as long-running transactions or locked tables?
- What are the patterns and trends in row operations, such as insertions, updates, and deletions, and are there any sudden changes or bottlenecks that might affect overall database performance?
- How do the configuration settings of my PostgreSQL instances compare with recommended best practices and are there any adjustments needed to optimize performance and reliability?
Better Together
When it comes to observing the services you rely on, Observe Apps can get you there in just a few clicks. But they go way beyond. They make collecting, analyzing, and correlating data with other observability information more accessible and efficient. Once in Observe, the possibilities to gain new insights from your data, old or new, are virtually limitless. And the more Apps you add, the more insights you’re likely to find.

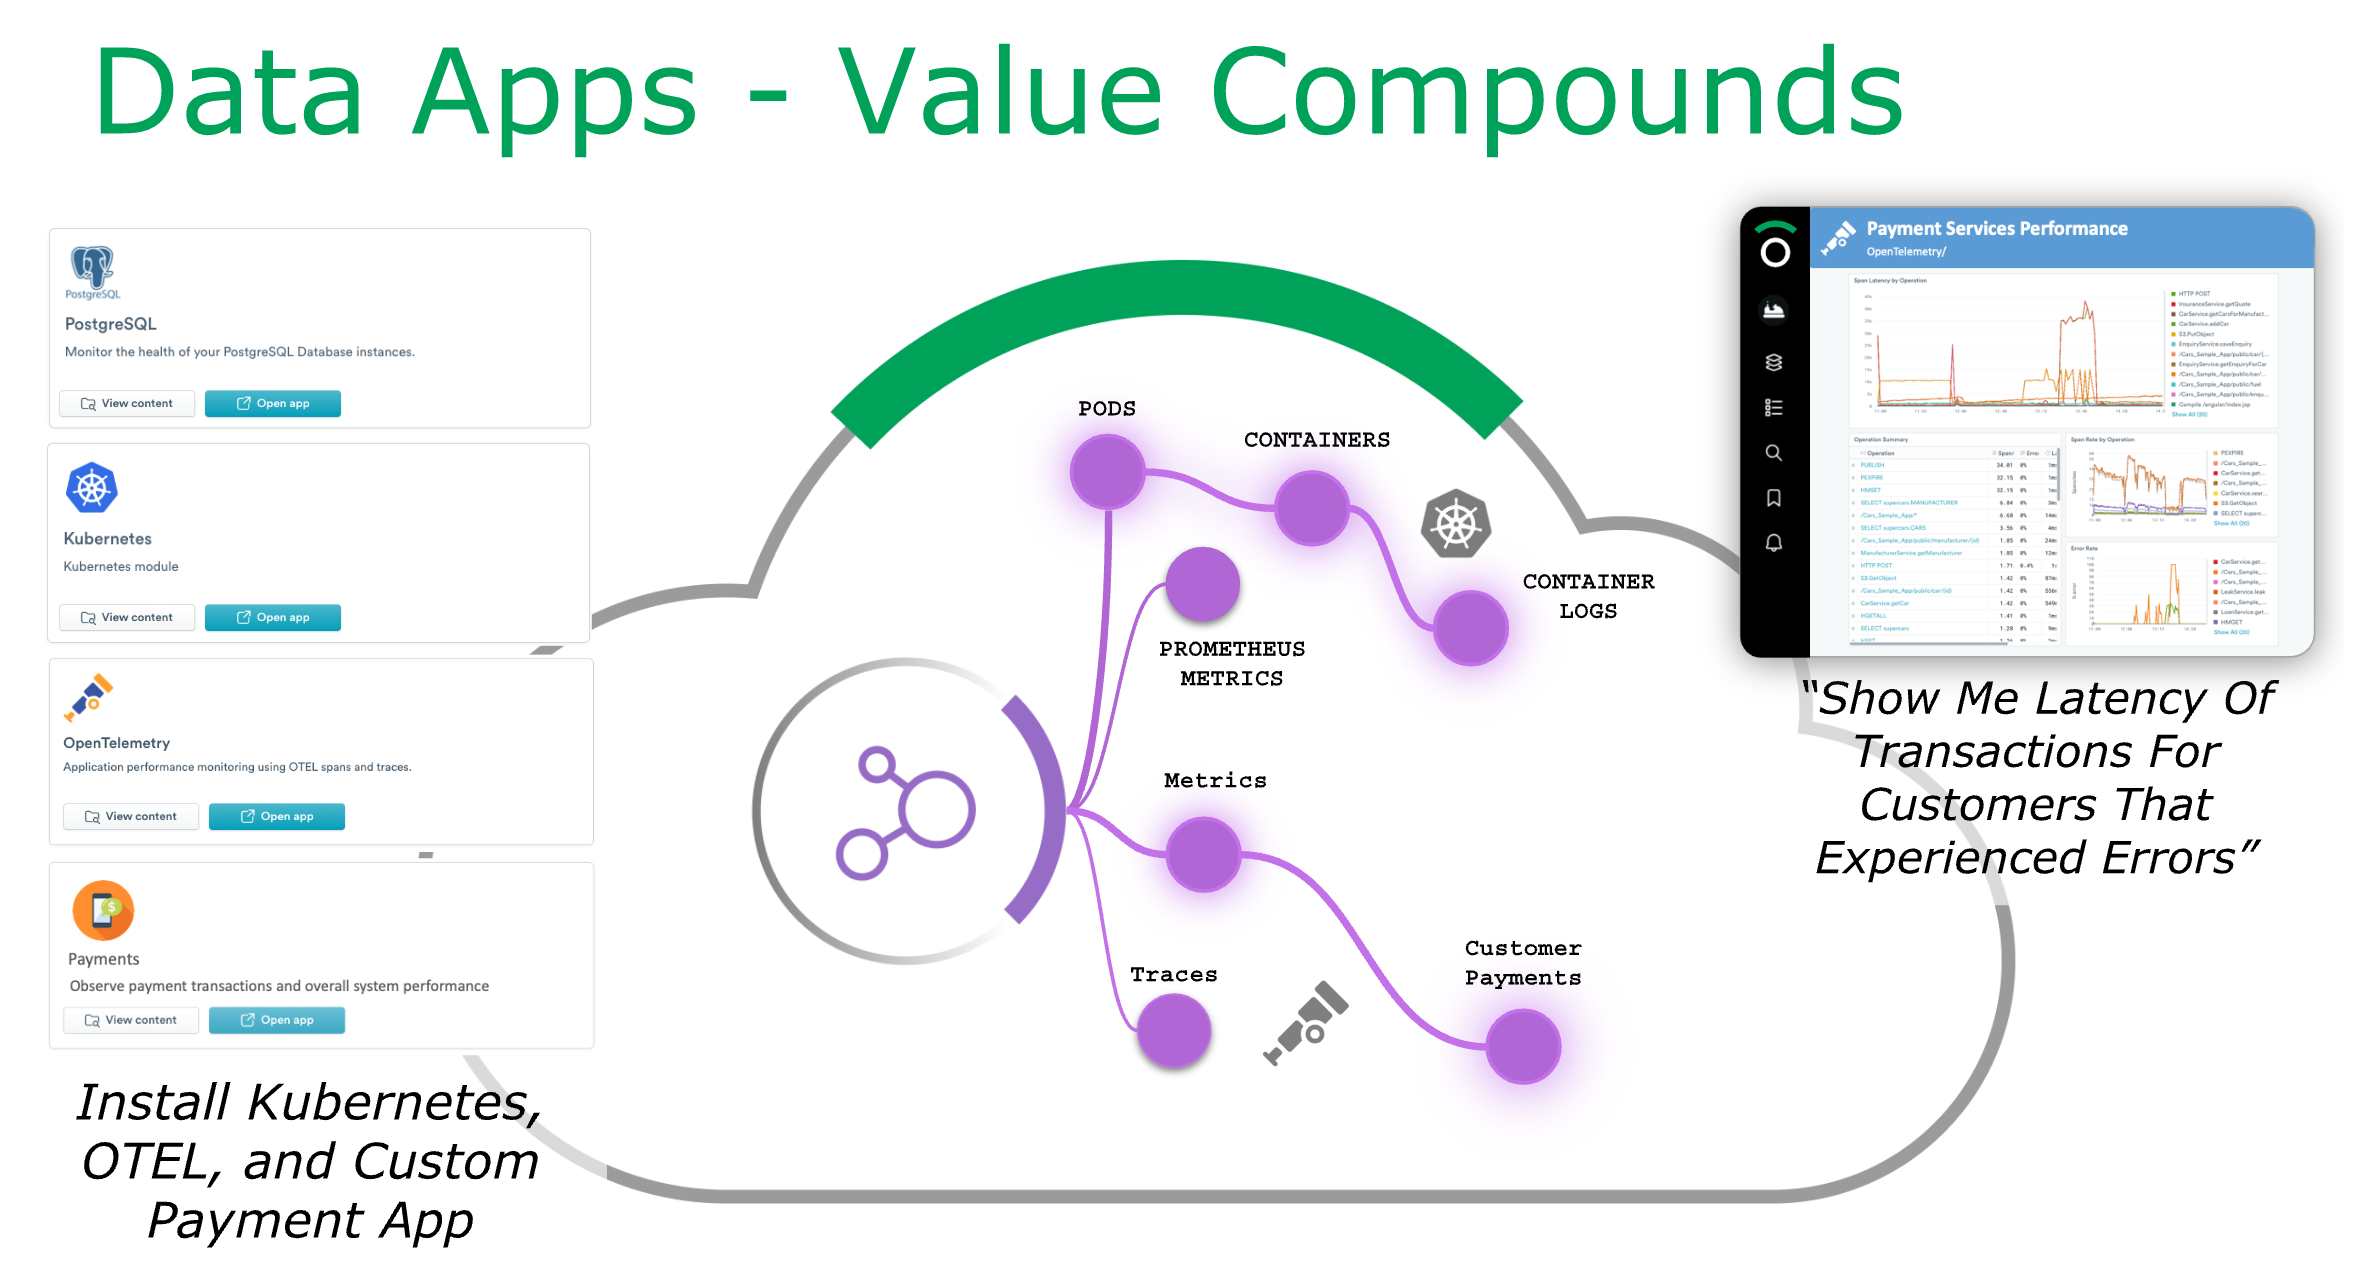
Observe can this because of the unique architecture of the Observability Cloud, which consists of Data Apps, the Data Lake, and the Data Graph. The PostgreSQL App is an example of a Data App, which enables effortless data ingestion into the Data Lake.
Once in the Data Lake, your data is transformed into Datasets or “things” of interest — such as users, pods, or customer tickets — and then linked together automatically when relationships are found. Then, by utilizing tools like GraphLink, and the Data Graph, you can swiftly navigate these connections found in your data — enabling you to quickly find relevant context during investigations, and answer critical questions from your observability data.
Let’s explore just a few of the ways this data can be used outside of observing individual PostgreSQL instances.
- Quickly jump from PostgreSQL metrics in the Dashboards to the host (Linux or Windows operating systems) they run on with the Host Monitoring App to confirm system resources aren’t the culprit when troubleshooting database issues.
- After installing the Kubernetes App, configure the PostgreSQL App to collect metrics and logs from Kubernetes to easily monitor your Kubernetes-based Postgres instances with the included Dashboards and Monitor templates.
- Combine Error Logs from Postgres, with traces found in the OpenTelemetry App to diagnose whether the cause of slow queries lies within your infrastructure or your application.
- Furthering the example above, add in Customer Tickets from Zendesk to see which customers were impacted, and how.
Observe’s ability to connect seemingly unrelated data, and virtually endless data types, from multiple sources, lets users bridge the gap between their database instances and other observability data for a more comprehensive understanding of their systems.
Installation
To install the latest PostgreSQL Apps, visit the PostgreSQL App installation guide in our documentation. You’ll find detailed instructions on how to install and configure the App, along with comprehensive guides on their features, included Dashboards, Datasets, and Monitor templates.
Wrapping Up
We’ve only just begun to scratch the surface of how the PostgreSQL App can make observability more turnkey for your Postgres database instances, so please visit the docs for more information and use cases. And if you also rely on MySQL for some of your database needs, check out the MySQL App we recently released.
Don’t forget to check out our ever-growing list of available Apps to help you easily ingest crucial telemetry data from the services you rely on. The more Apps you install means more relationships you’ll find, less time troubleshooting, and more time building features that your customers will love. But, don’t let cost concerns get in the way of discovering new connections in your data.
Our usage-based pricing allows you to confidently expand your App ecosystem, ingest all observability data you find important, and keep it for as long as you like. This efficient and cost-effective approach allows you to focus on enhancing observability without compromising your budget.

