What’s New: MongoDB Atlas App!
Introducing the MongoDB Atlas App!
We’re excited this week to announce the launch of our latest App — the MongoDB Atlas App!
MongoDB Atlas is a fully managed cloud database service that simplifies the deployment, management, and scaling of MongoDB databases in the cloud. And thanks to Observe’s latest App, monitoring these databases becomes effortless.
But the MongoDB Atlas App goes beyond monitoring; it comes loaded with pre-built Dashboards, Datasets, and pre-configured Monitor templates to make observing your MongoDB resources as easy as installing an App. This ensures you gain insights quickly from your MongoDB databases without having to sift through mounds of machine data.

With the standalone App, you can easily answer questions related to common database metrics like “How is the overall query performance of my databases?”, or, “Are any of my databases close to reaching their connection limits?” But the real magic happens when you connect data from the MongoDB Atlas App to other sources in Observe. By linking and combining this data with data from other Apps — like AWS, Kubernetes, and OpenTelemetry — you can gain a more comprehensive understanding of your entire environment’s health and ask more complex questions.
Let’s take a closer look at the App to see how it makes observability more turnkey when it comes to your MongoDB Atlas databases!
What’s Included
The MongoDB Atlas App contains everything you need to observe your MongoDB Atlas activity across your entire organization. Like our other Apps, it makes ingesting telemetry as easy as clicking a button; Dashboards help you gain insights at a glance, Datasets help you dig deep during investigations, and sample pre-configured Monitors to alert you on the things that matter most to you.
Let’s further explore what content this App contains and the many questions it can help you answer.
Dashboards
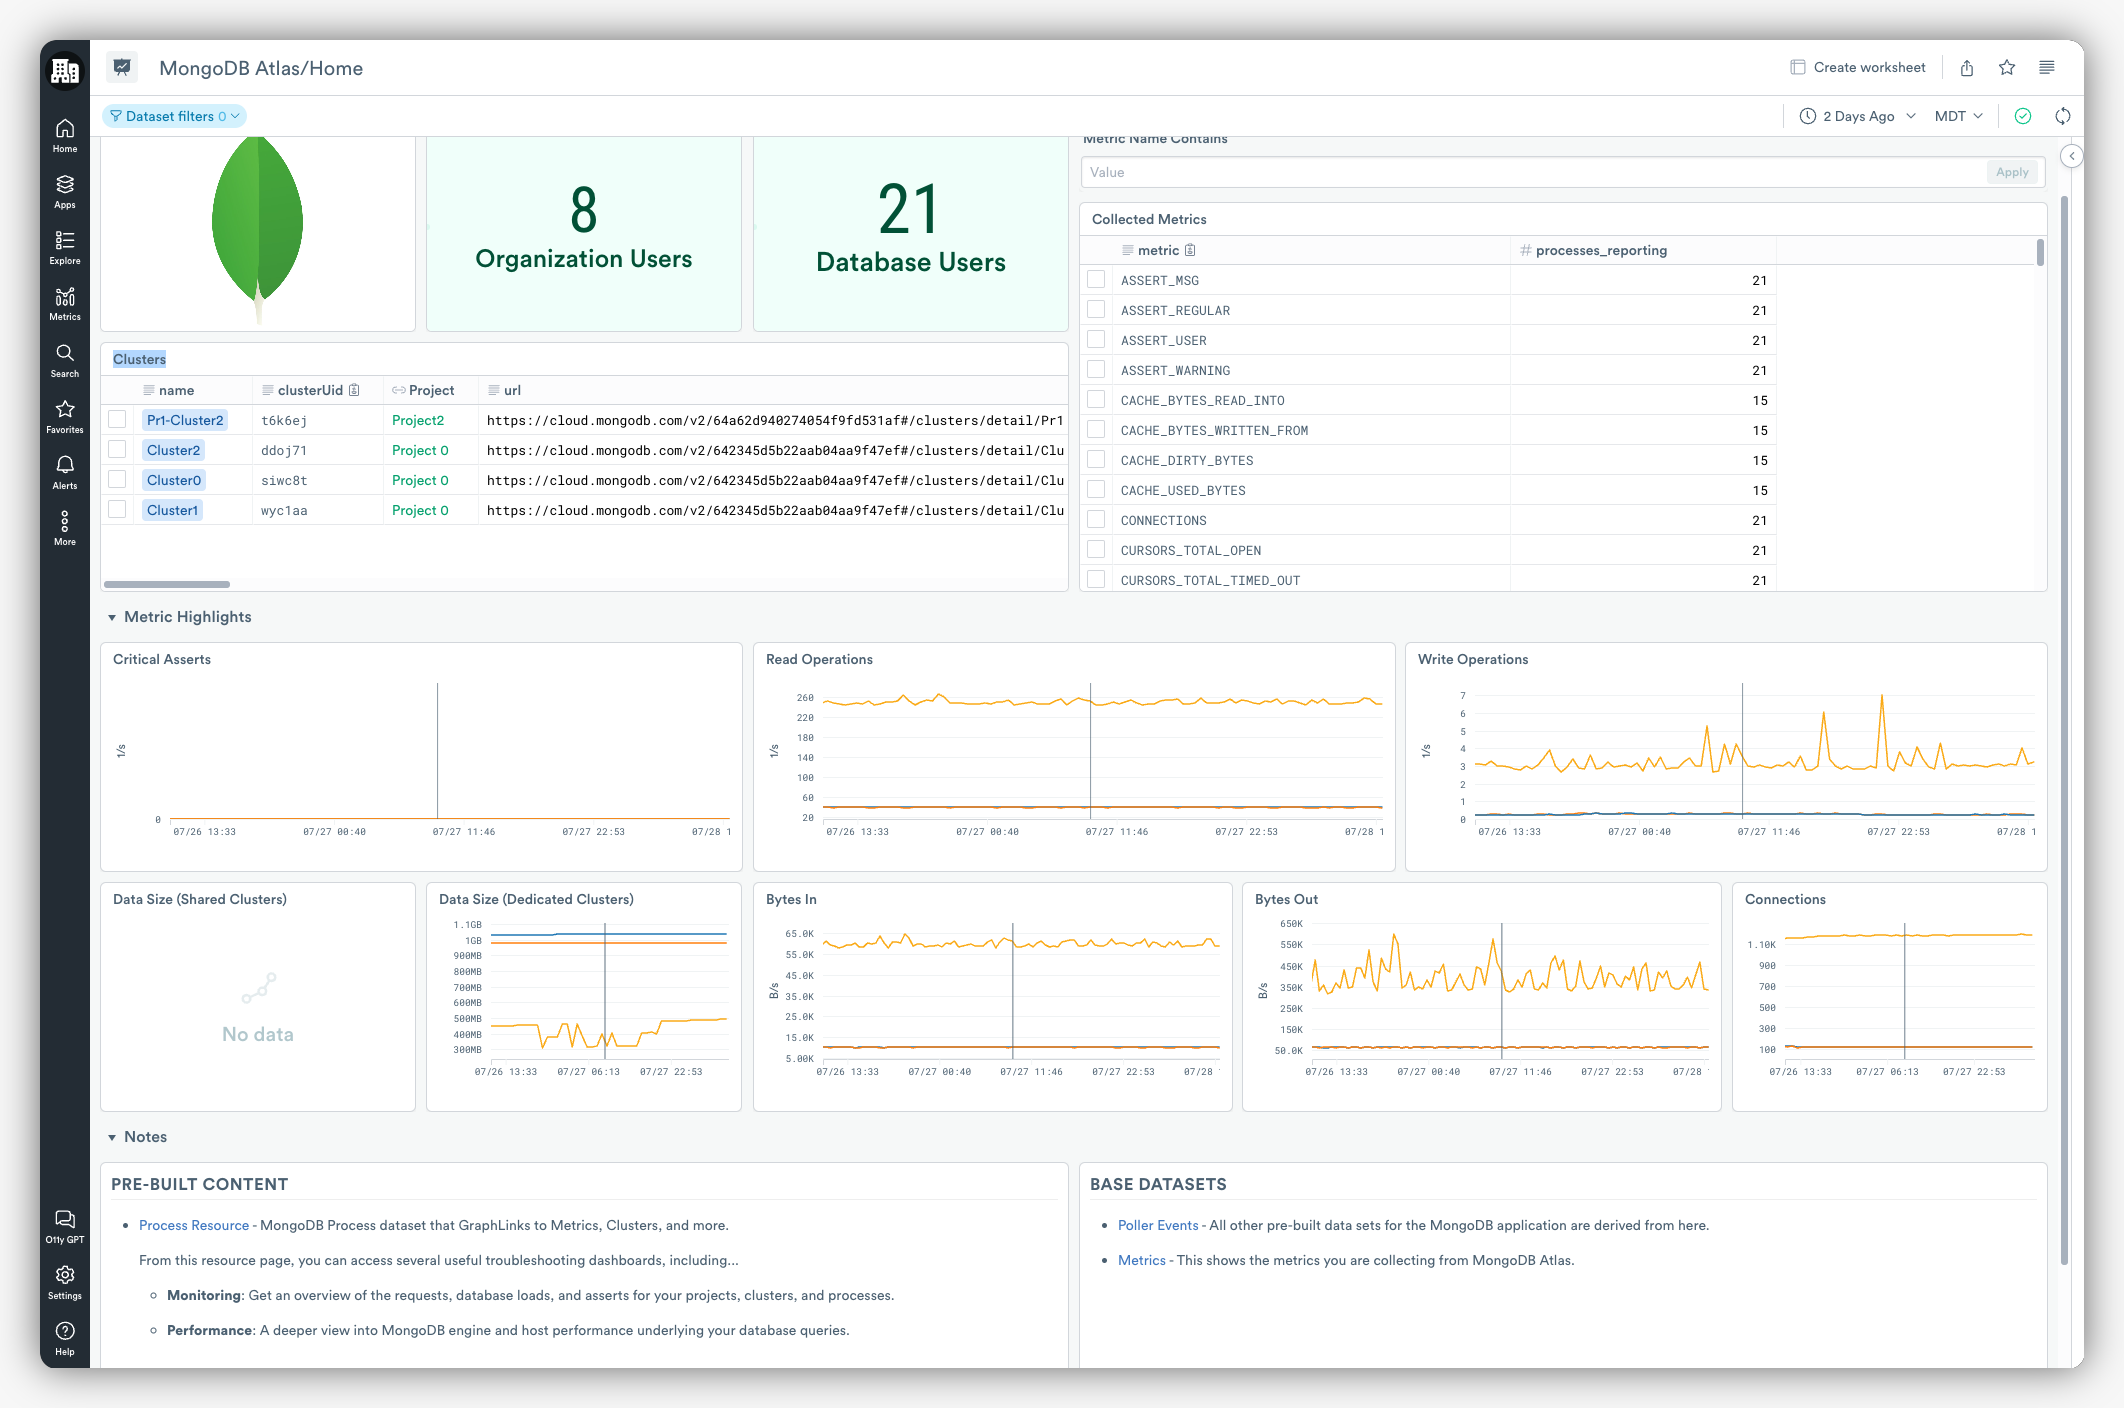
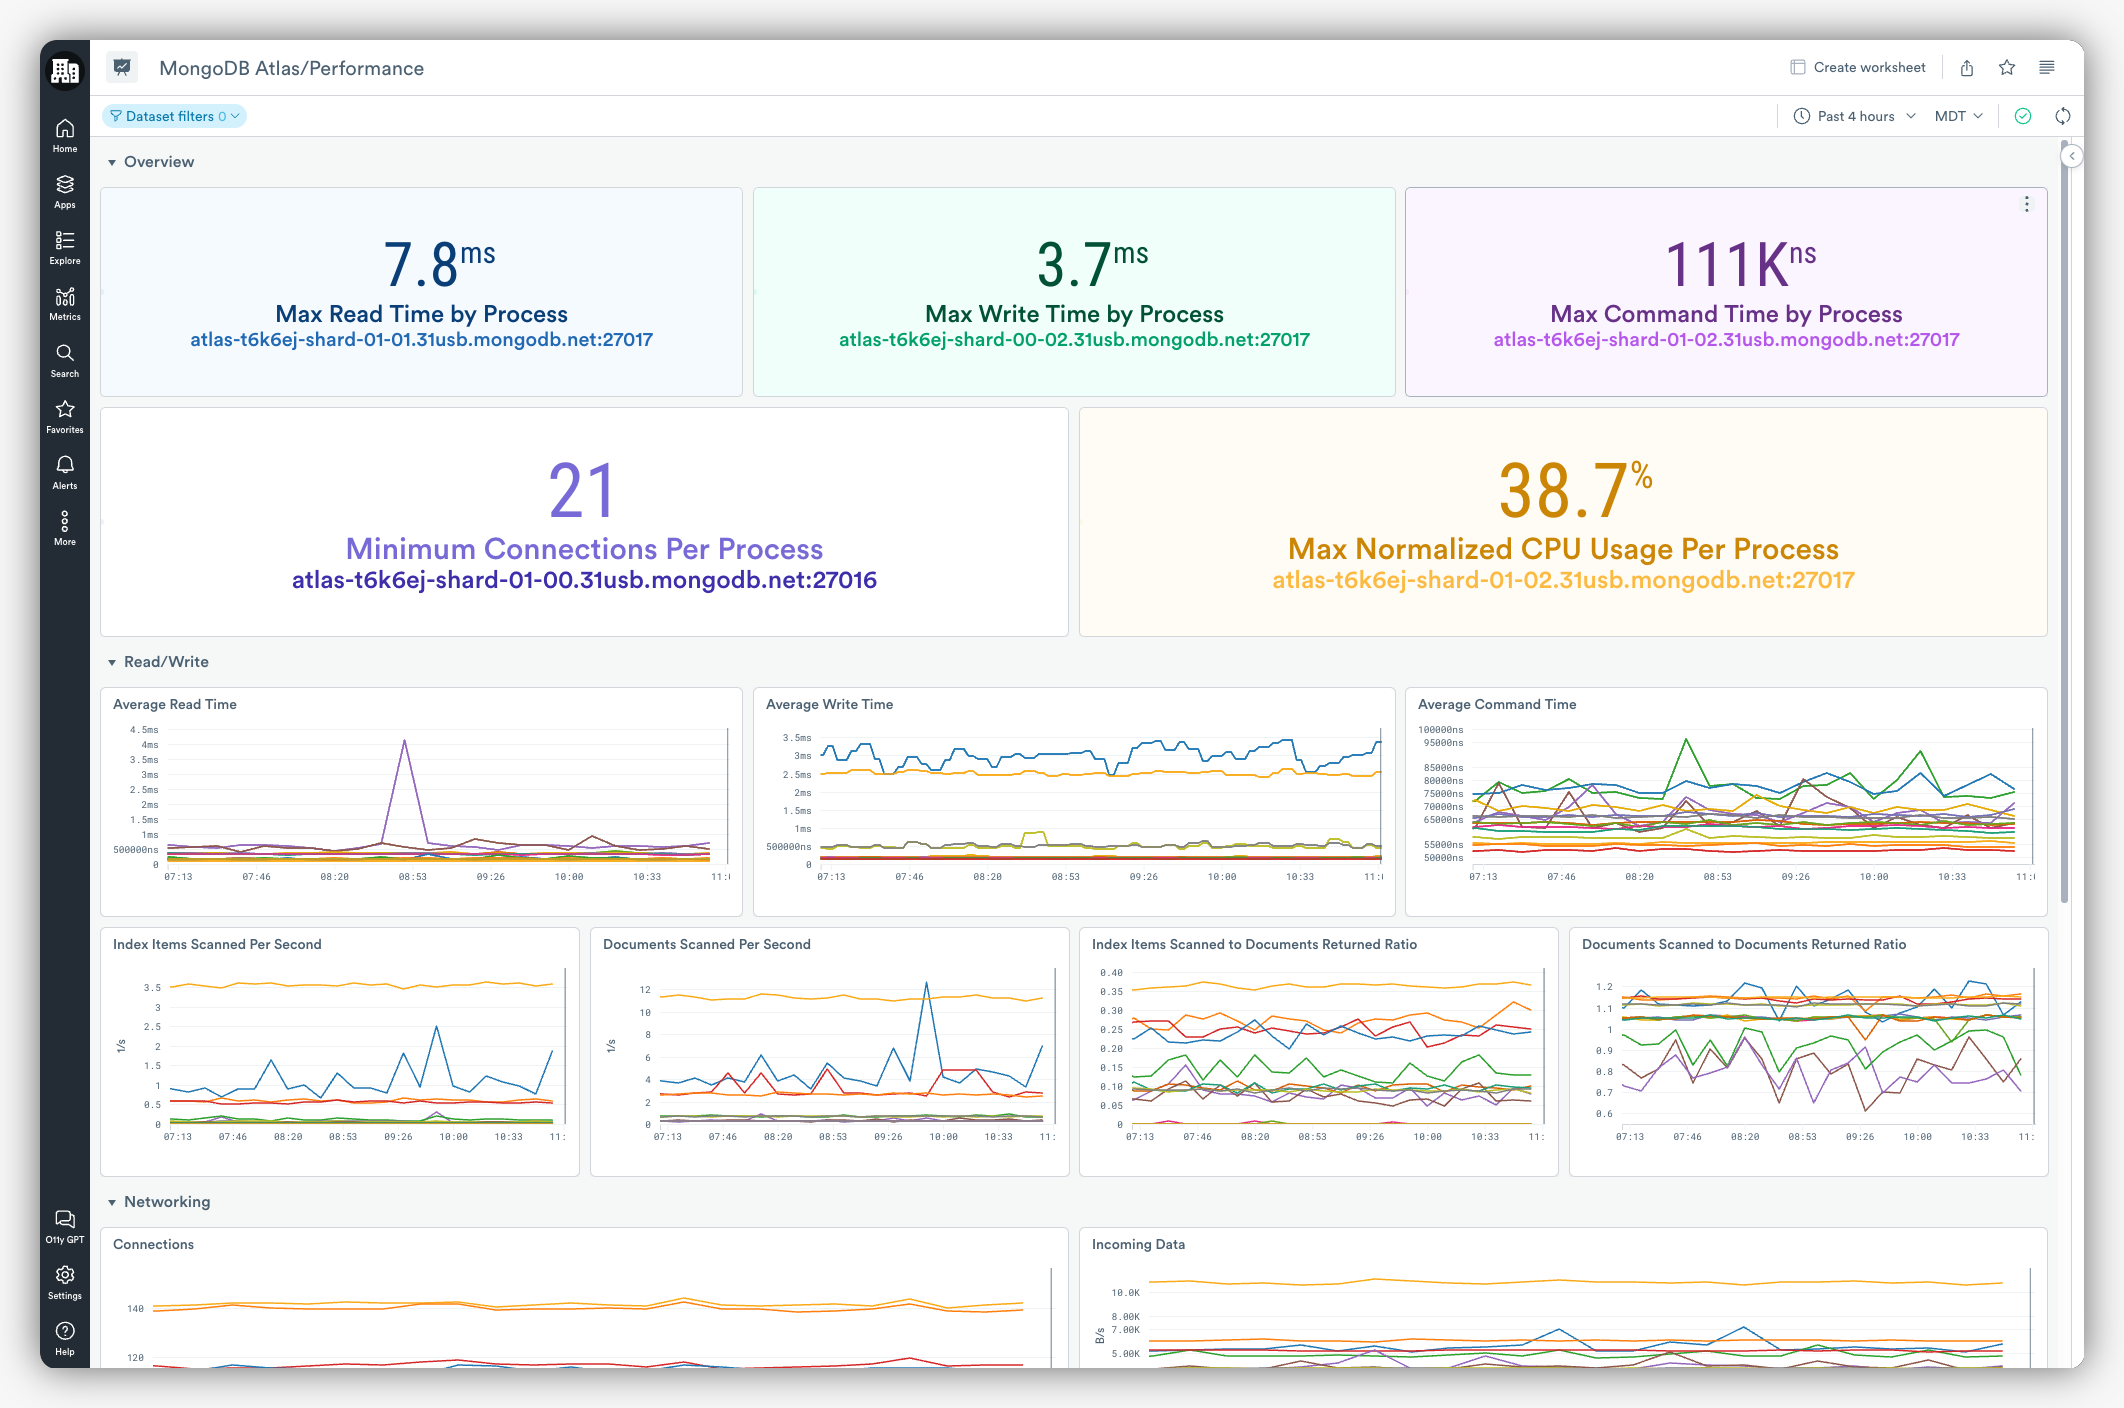
The MongoDB Atlas App includes three Dashboards — Home, Performance, and System Metrics — that provide you with the most crucial metrics to help you understand the health of your databases at a glance. Users can also easily edit these pre-packed Dashboards further to customize them to your organization’s unique needs.
The Home Dashboard (above) is a great starting point for investigations as it provides a high-level overview of your organizational output. You’ll find an overview of the various users in your organization, detailed information at the cluster level, as well as metric highlights around read/write times, total storage volume by cluster, database connections, and much more.
In addition, the Performance Dashboard (below) provides an even deeper view of the MongoDB engine and host performance underlying your database queries. Use this dashboard to get a more detailed view of the operations of your MongoDB Atlas processes like CPU and memory metrics, storage metrics, read/write times, and cache metrics, just to name a few.

Lastly, the MongoDB Atlas App contains a Monitoring Dashboard that provides a comprehensive overview of all of your MongoDB Atlas clusters and processes. It highlights key metrics such as Asserts, Operations, and Connection availability, allowing for a quick summary view.
Datasets
The MongoDB Atlas App collects various metadata about your organization, projects, clusters, and processes and then transforms it into Datasets. These Datasets serve as the foundation for the Dashboards and offer the raw metrics, logs, and event data necessary for advanced troubleshooting — helping you uncover hidden connections in your data.

In this App, you’ll find eight Datasets to assist you in your search for more context around an issue. Two Event Datasets — Metrics, and Poller Events — contain the raw telemetry found in all the other Datasets and six Resource Datasets; Project, Cluster, Process, Organization, Org User, and Database User that comprise common “things” that you might want to ask questions about in regards to your MongoDB Atlas instances.
Resource Datasets also function as “landing pages” of sorts, that help show you how these objects change over time to help you get a better understanding of how your MongoDB Atlas databases behave in your environment. Lastly, Resource Datasets are the destination behind many links you find in our Dashboards, to help provide more context about a given resource.
Monitor Templates
The MongoDB Atlas App includes six pre-configured Monitors such as Read and Write Throughput Monitors, which allow for detailed insights into both reading and writing operations across clusters and databases. These monitors help in identifying performance bottlenecks, ensuring optimal resource allocation, as well as capacity planning efforts.

You’ll also find a No Active Connections Monitor that will alert you when no active connections are found on any of your MongoDB Atlas databases. This can be handy where timely detection of connection loss is crucial for minimizing downtime and ensuring smooth operation.
Lastly, you’ll find the Critical Assert Thrown Monitor which will alert you when a critical error is detected, and the Max Shard Size Reached Monitor which will warn you when a shard within the database has reached its maximum size.
Apps Are Better Together
When it comes to observing the services you rely on, Observe Apps can get you there in just a few clicks. But they go way beyond. They make collecting, analyzing, and correlating data with other data in Observe easier, and once in Observe, the possibilities to gain new insights from your data, old or new, are virtually limitless.
And the more Apps you add, the more insights you’re likely to find!

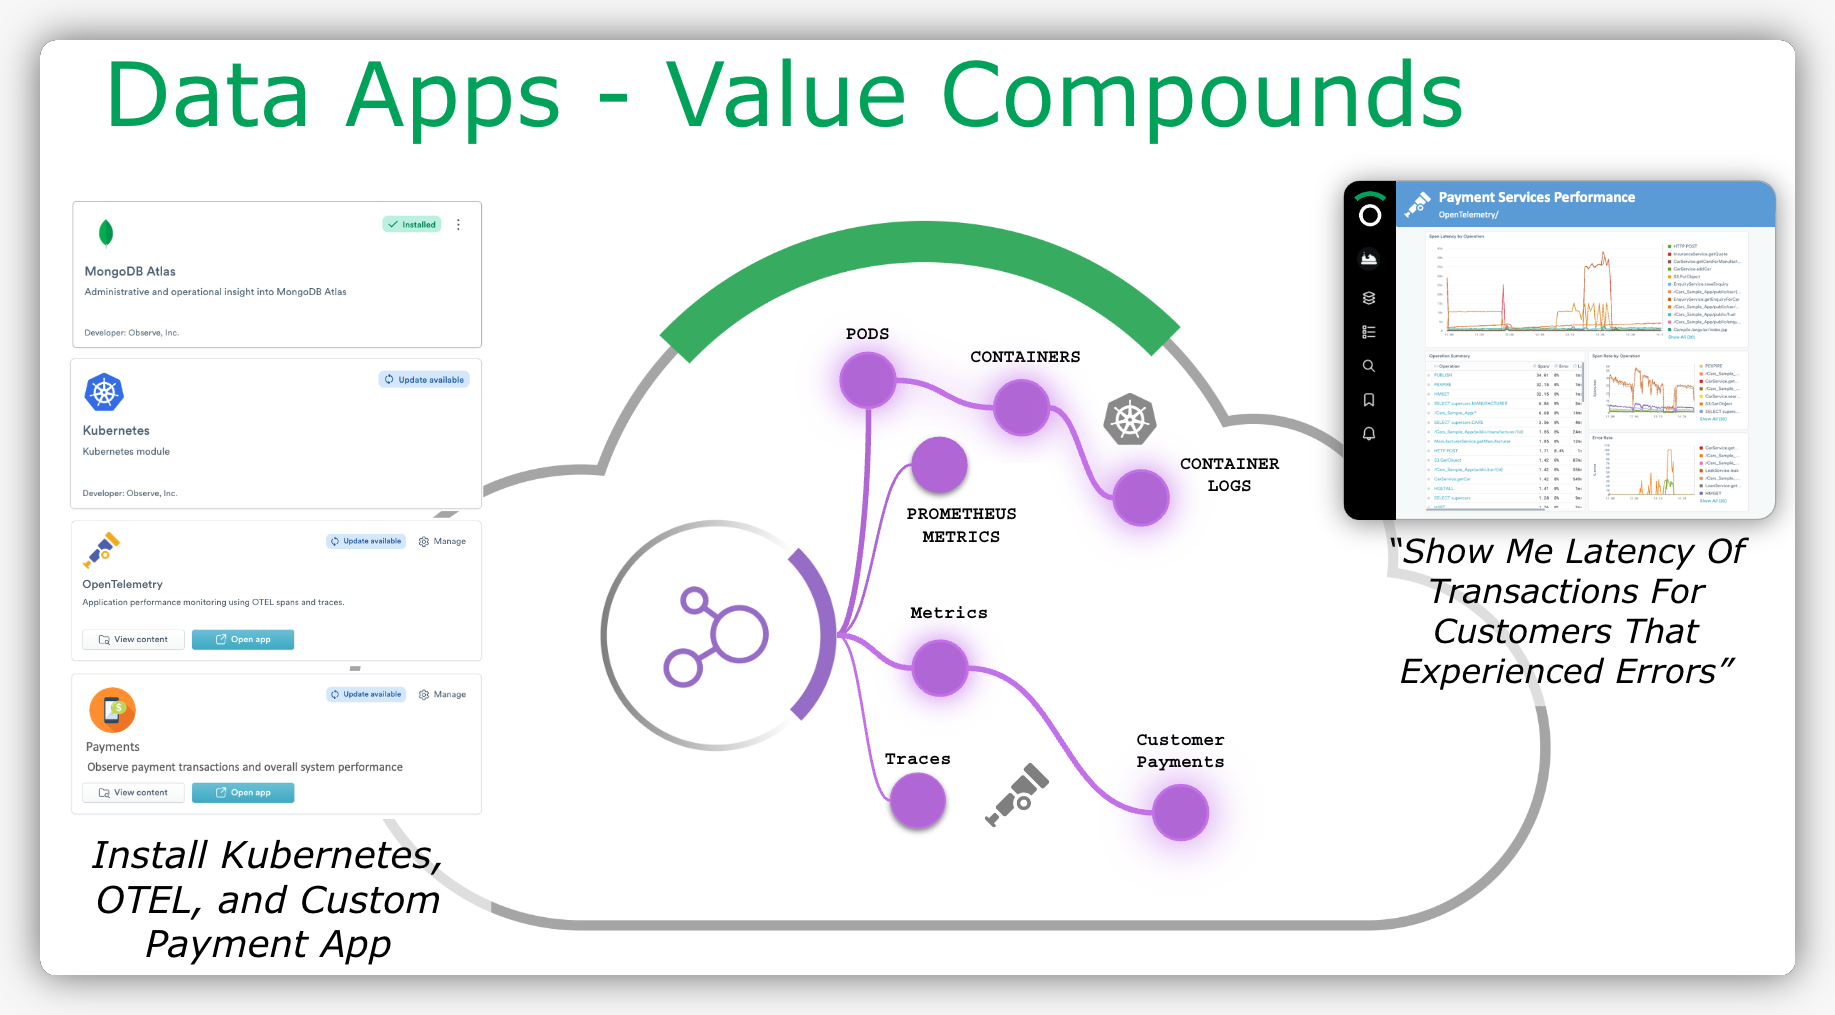
Observe can this because of the unique architecture of The Observability Cloud, which consists of Data Apps, the Data Lake, and the Data Graph. The MongoDB Atlass App is an example of a Data App, which enables effortless data ingestion into the Data Lake.
Once in the Data Lake, your data is transformed into Datasets or “things” of interest — such as users, pods, or customer tickets — and then linked together automatically when relationships are found. Then, by utilizing tools like GraphLink, and the Data Graph, you can swiftly navigate these connections found in your data — enabling you to quickly find relevant context during investigations, and answer critical questions from your observability data.
Let’s explore just a few of the ways this data can be used outside of observing individual MongoDB Atlas instances.
- If you use the Atlas Kubernetes Operator to deploy your MongoDB Atlas resources, you can connect Container Logs from the Kubernetes App with the Metrics Dataset (from the MongoDB Atlas App) to see what resource demands your application puts on your MongoDB databases. This can be handy for helping you develop intelligent scaling strategies for your applications.
- Extending the example above, you could also combine traces from OTEL (using the OpenTelemetry App) to reveal how database operations impact user sessions — ultimately leading to more informed decisions about optimization.
- Assuming you deploy your MongoDB Atlass resources using GitHub, install the GitHub App and link the Commit Dataset and the MongoDB Metrics Dataset to understand how specific code changes affect database behavior and overall application performance.
- Lastly, install the Zendesk Integration and begin analyzing patterns between customer tickets and MongoDB Metrics to develop predictive models that can forecast potential issues BEFORE they impact the customer.
Installation
To install the latest MongoDB Atlas App, visit the installation guide in our documentation. You’ll find detailed instructions on how to install and configure the App, as well as how to configure the Observe poller for MongoDB Atlas. After configuration, data from MongoDB Atlas populates the datasets and dashboards and displays information about your organization.
In the installation guide, you’ll also find more comprehensive guides on the App’s features, including Dashboards, Datasets, and Monitor templates.
Wrapping Up
We’ve only just begun to scratch the surface of how the MongoDB App can make observability more turnkey for your MongoDB instances, so please visit the docs for more use cases.
Lastly, don’t forget to browse our ever-growing list of available Apps to help you easily ingest crucial telemetry data from the services you rely on. The more Apps you install means more relationships you’ll find, less time troubleshooting, and more time building features that your customers will love. But, don’t let cost concerns get in the way of discovering new connections in your data.
Our usage-based pricing allows you to confidently expand your App ecosystem, ingest all observability data you find important, and keep it for as long as you like. This efficient and cost-effective approach allows you to focus on enhancing observability without compromising your budget.
If you’re not already an Observe customer but want to see how observability is as easy as installing an app, then click here to get access today!

