What’s In A Data App?
This post is one of many in a series that attempts to explain basic concepts and terminology around Observe, and “The Observability Cloud.” Topics will range from architecture to deeper technical dives into topics like Temporal Algebra, Schema-On-Demand, and more.
The Observability Cloud is based on an entirely new architecture that changes how you ingest, store, analyze, and visualize observability data. Composed of three components; the Data Lake to unify telemetry, the Data Graph to map and link relevant Datasets, and Data Apps to make observability more turnkey from your favorite services.
Let’s look more closely at Data Apps and how they help the Observability Cloud deliver on these promises.
Beyond Integrations
Every observability product has integrations, often hundreds of them, but a ton of integrations does not necessarily equate to value. Integrations are necessary in today’s world where organizations rely on dozens of services to build, deploy, and manage their infrastructure and applications their customers rely on. They provide an easy way to get data from these services to a place you can analyze it for your observability needs. However, integrations alone don’t get you closer to observability, and the insights users need to make important decisions from their telemetry.
Most organizations spend countless hours indexing, parsing, tagging, and massaging mounds of machine data before it can become useful — a luxury no organization has. Observe knew there was a better way to deliver value from your data quickly, so we created Data Apps.

Observe’s Apps go beyond integrations by bundling everything you need for investigating incidents and discovering new insights into one package. With tons of out-of-the-box content like Dashboards, sample monitors, and curated Datasets, Apps make it easy to get up and running with some of the more common scenarios you might encounter in your environment. For instance, the Kubernetes App provides a sample monitor to let you know when a container has been killed because of an OOM error, as well as Dashboards loaded with pod, node, container, and even deployment metrics.
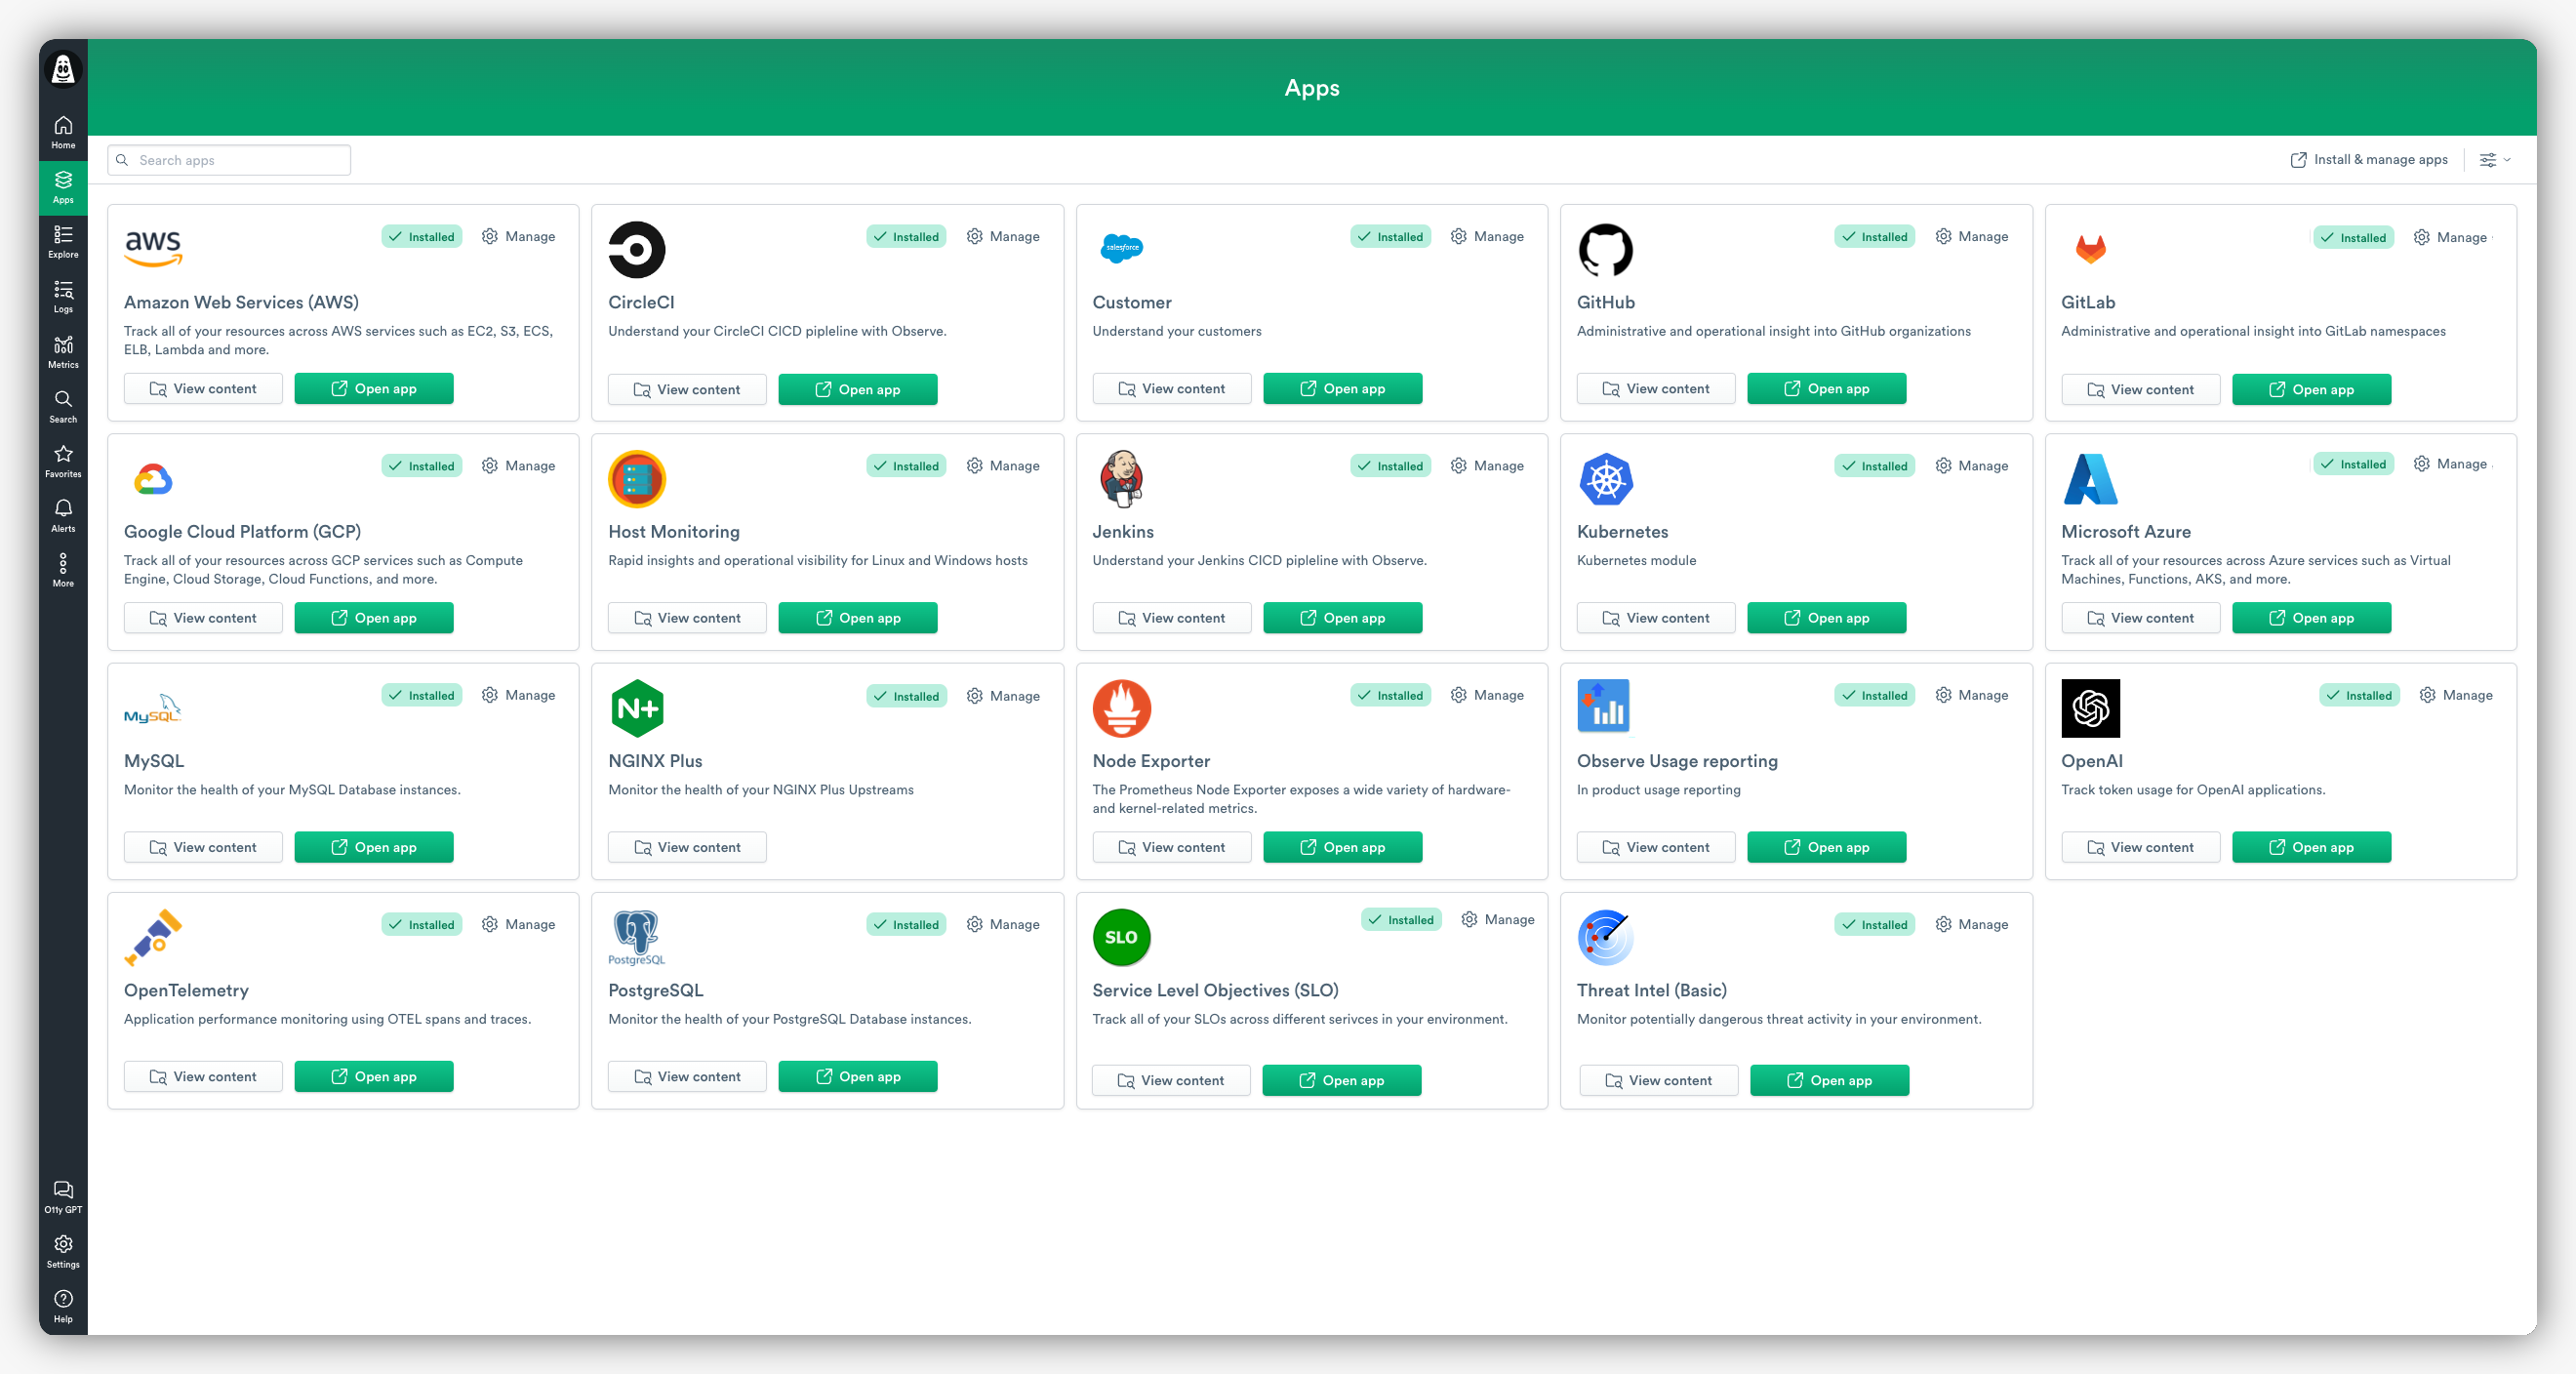
Whether it’s investigating an outage, or discovering a major source of user friction in your application, you’ll save time by not having to dig through mounds of machine data. And with over 20 Apps (and over 250 integrations in total), you’ll be able to observe your infrastructure from all the major public cloud providers (AWS, Azure, and GCP), collect traces from OpenTelemetry, or even understand your customers better with our Salesforce App — and so much more.
Faster Time To Value
Our Apps are a breeze to install and manage thanks to our easy-to-use App-store experience. In just a minute or two Observe’s Apps can get crucial observability telemetry flowing from the applications you use most, but that’s just the beginning. The Dashboards, sample monitors, and Datasets provided by each app start filling with data immediately to make your data actionable — and quickly.
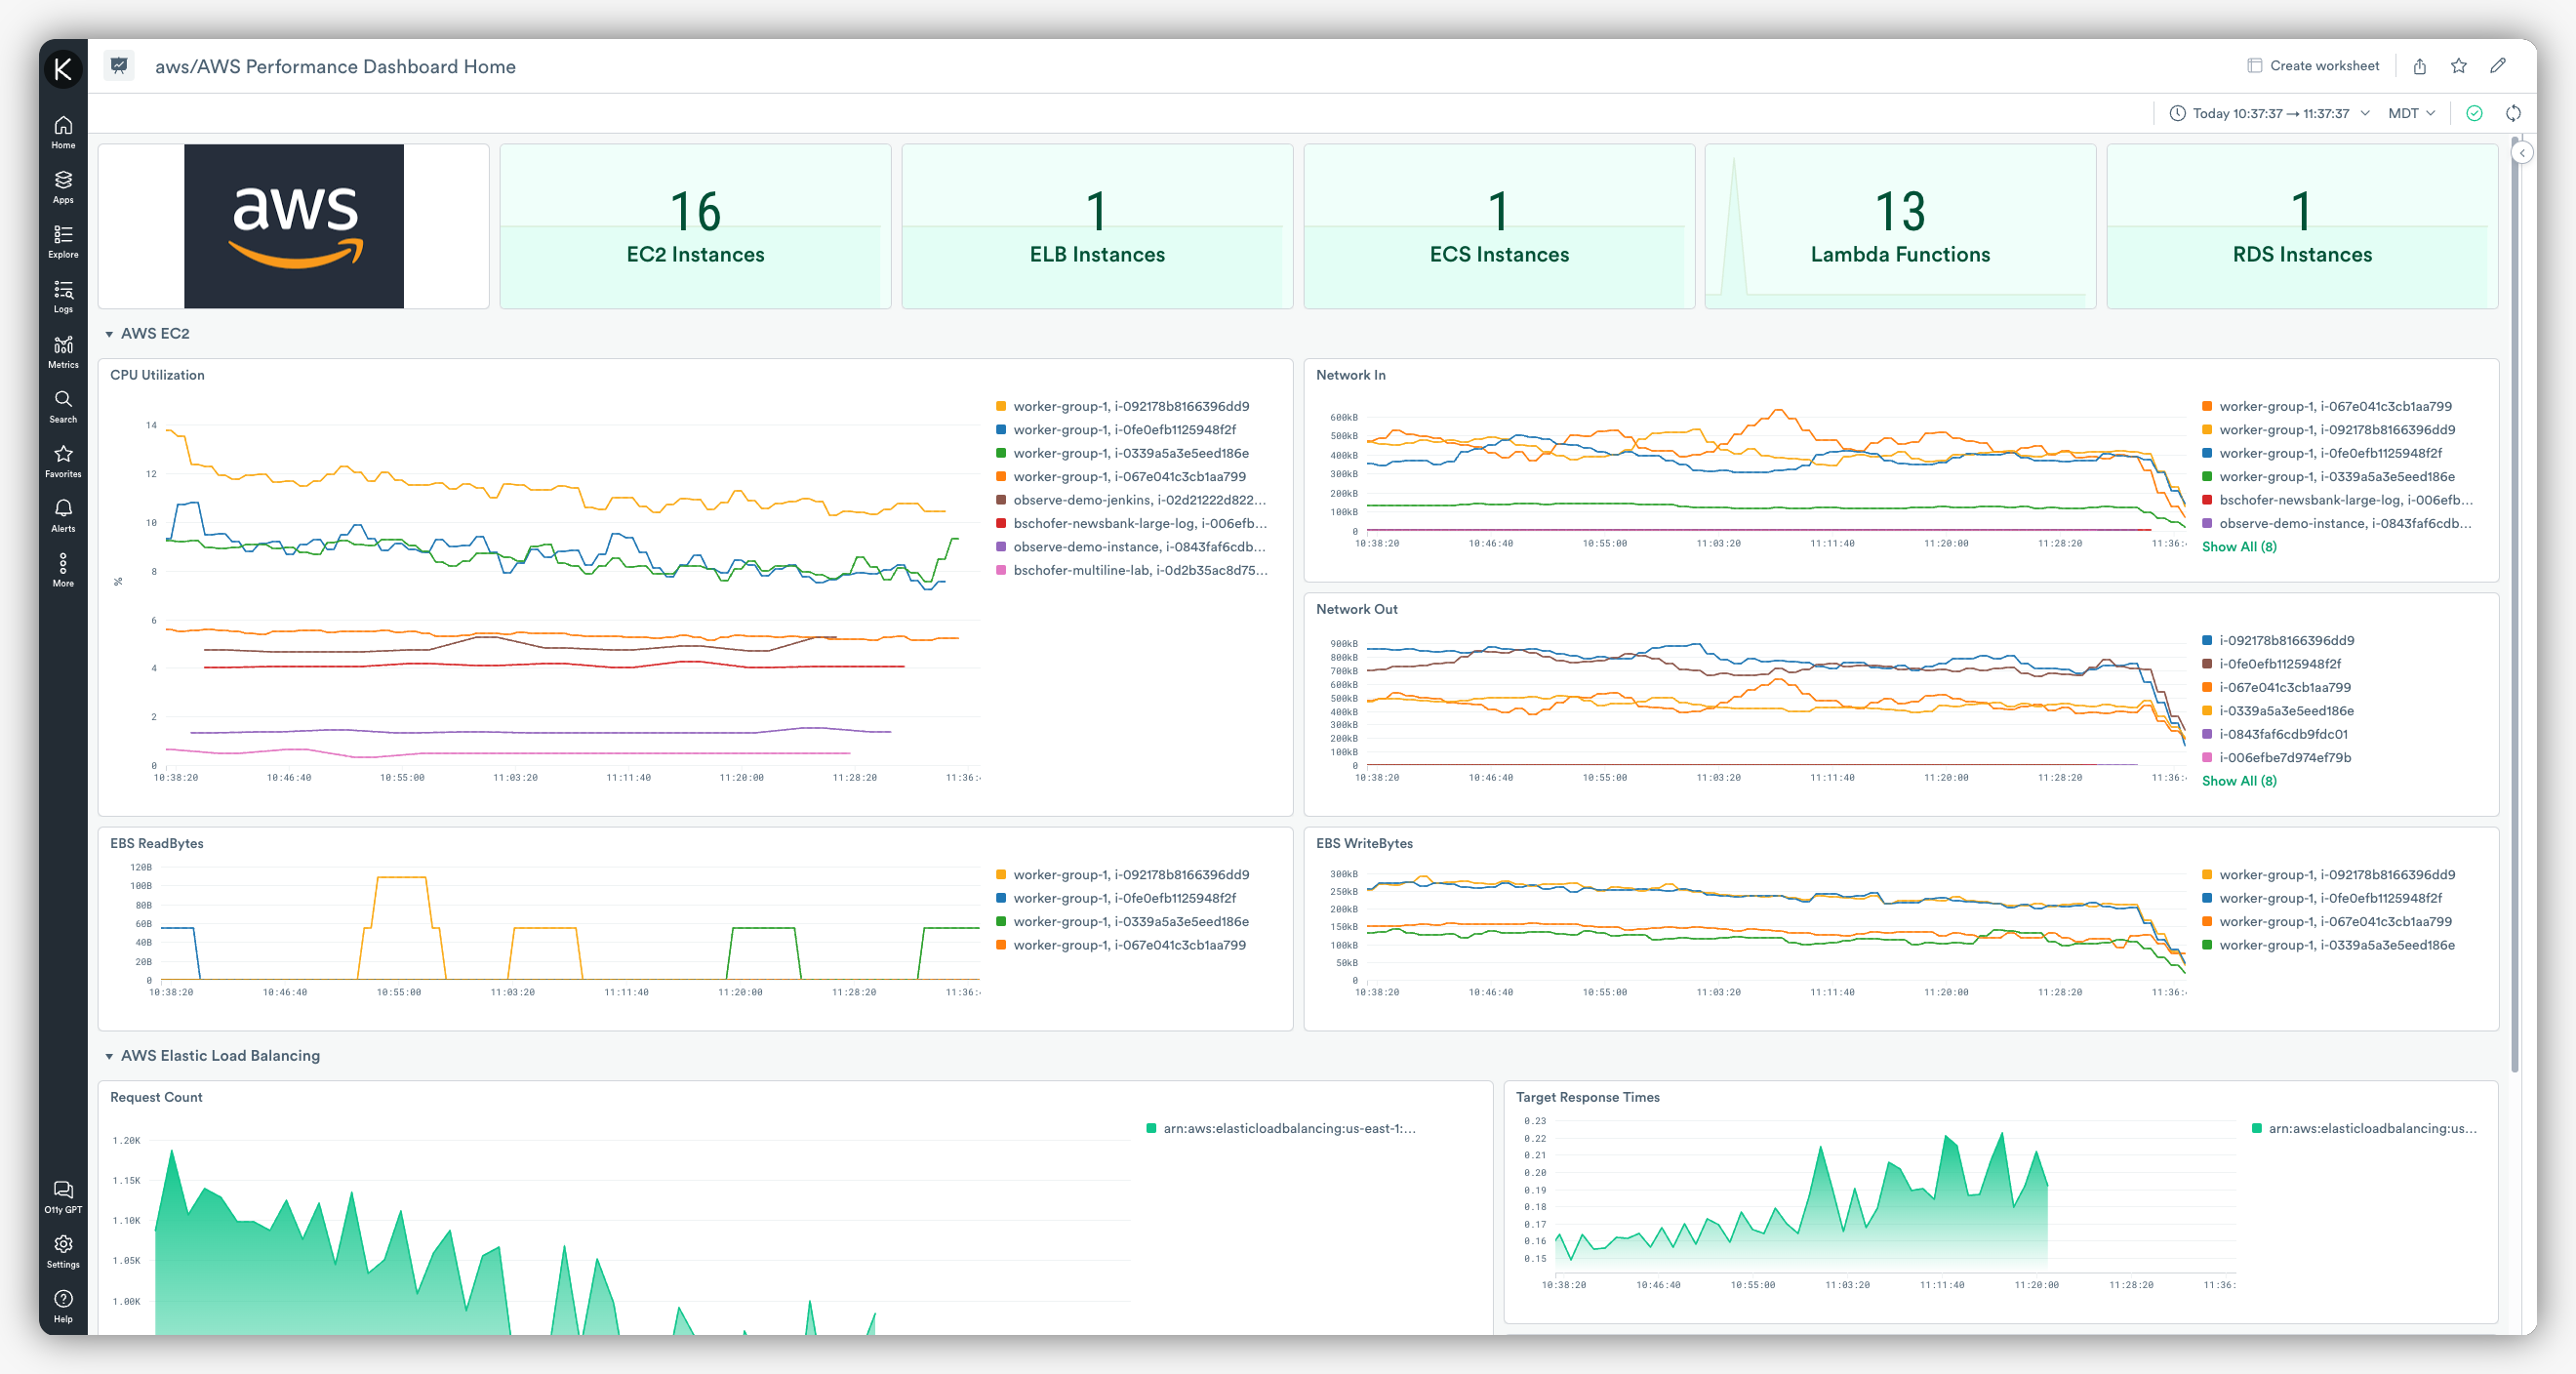
Observe Apps come with pre-built Dashboards that allow you to easily track, analyze, and display key metrics to make understanding the health of your environment as easy as possible. In addition, you can create your own custom Dashboard, and even auto-generate Dashboards using any Dataset you choose, to get more granular insights into the things that matter most to you.

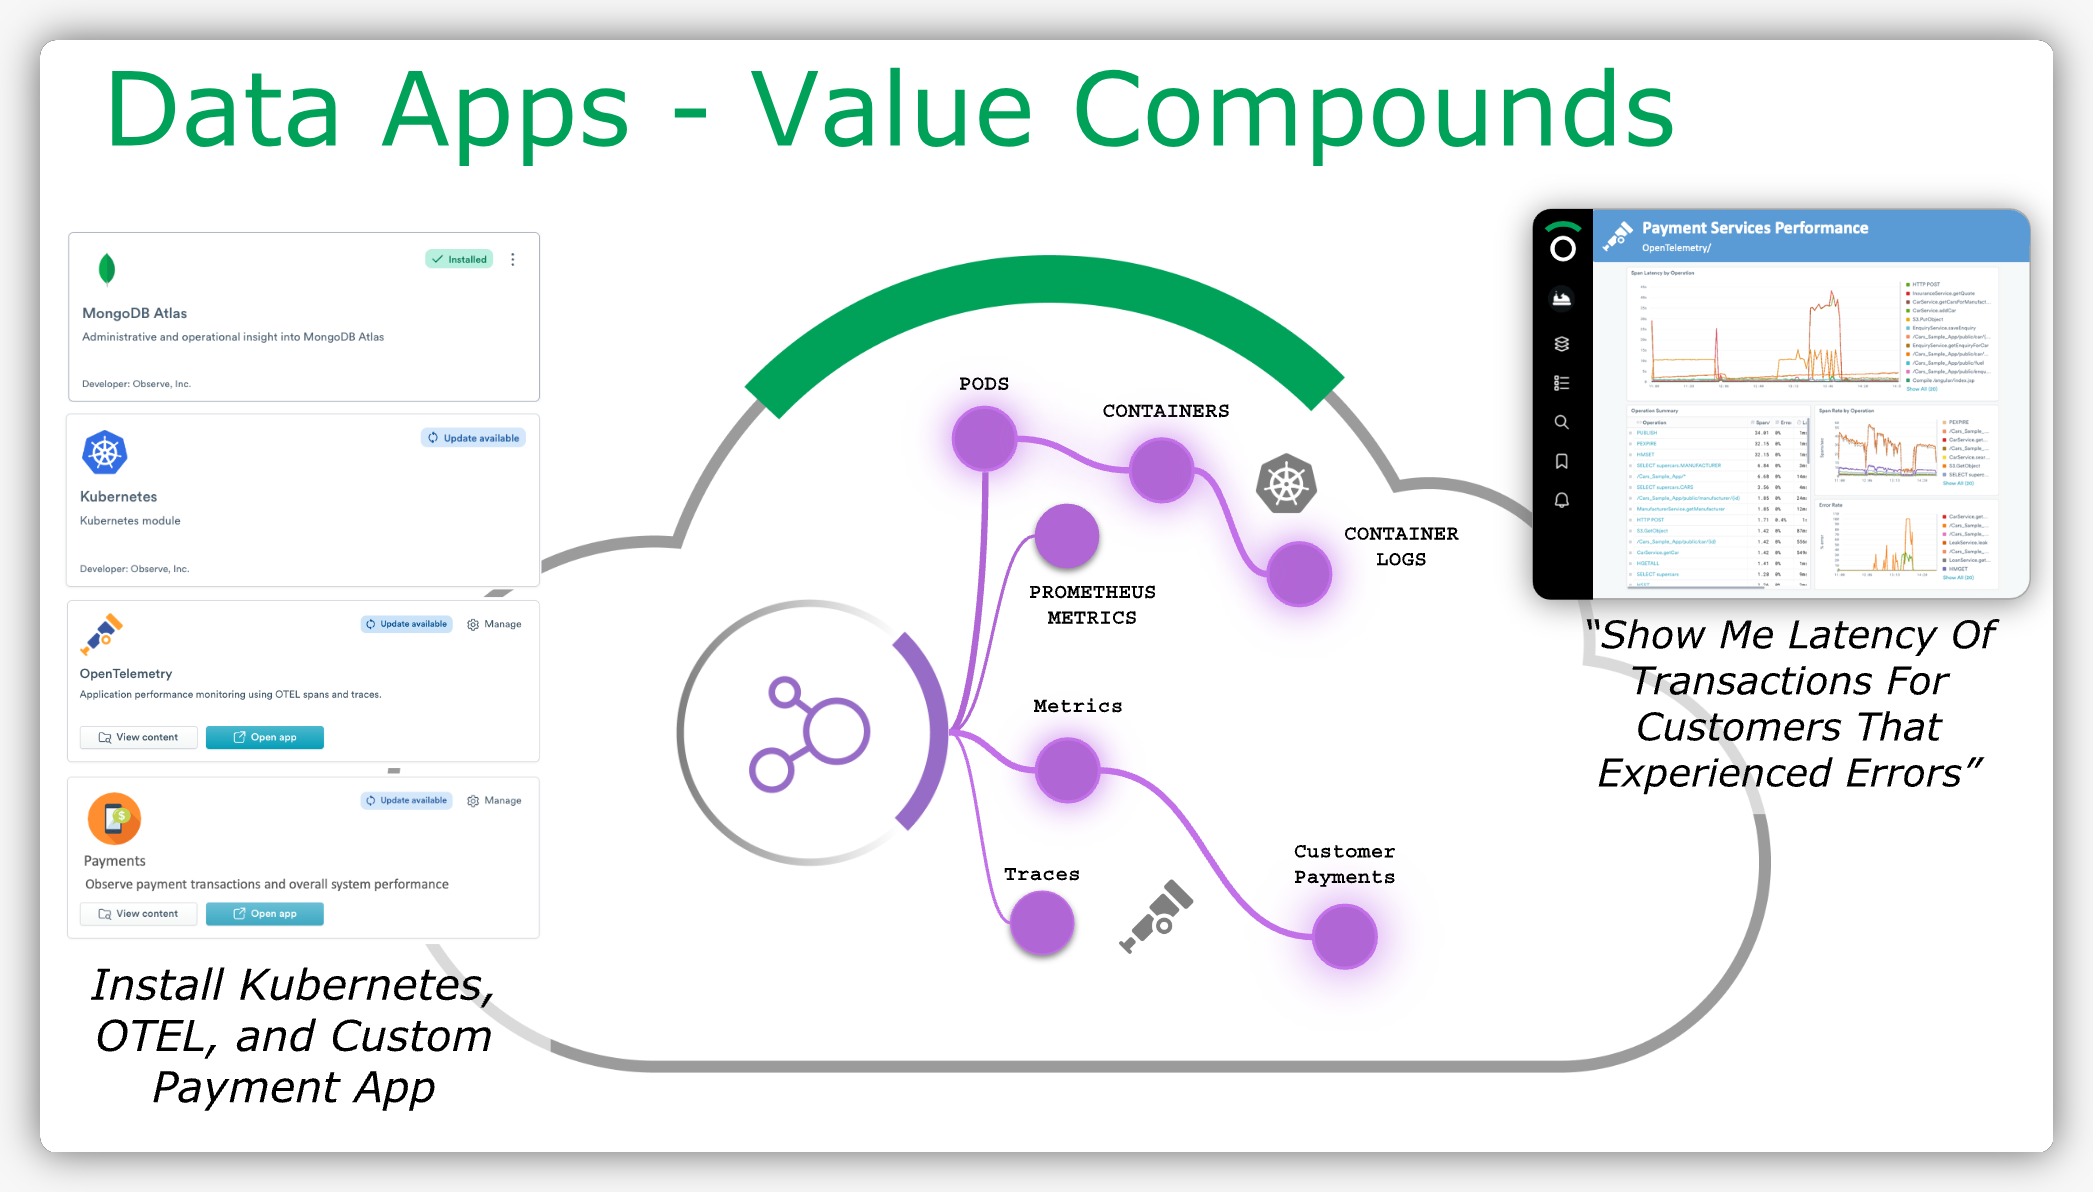
But our Dashboards go beyond pretty graphs and charts. Thanks to the power of GraphLink, you can click on any resource — like a server, Jenkins build, or even a trace — and drill down into the data (Dataset) behind the charts and graphs you see. This eliminates the need to open multiple tabs, or even multiple tools when investigating an issue. Besides answering basic questions like, “Show me the overall health of my payment application”, you can ask more granular questions like “Show me customers that experienced an error in the last hour”, or “Show me the container logs for pods that emitted an error.”
Lastly, each Observe App provides a handful of pre-configured monitor templates that allow you to quickly create monitors for specific events or conditions. These templates address common use cases and provide a starting point for users to customize and create their own monitors. The templates come with pre-defined OPAL statements that filter and manipulate the data to generate meaningful alerts.
Better Together
Observe Apps make monitoring and observing the services you rely on most a breeze, but their true potential lies far beyond a standalone monitoring solution. That’s because, for each App you install, the Data Graph grows and gets “smarter” as it’s populated with more and more data. With more data comes the potential to find more relationships, and thus more context. Both are crucial for reducing your MTTR and gaining new insights from data you already have.
Using a typical third-party monitoring or observability tool you can get visibility into the health of your cluster, but you’re left in the dark when it comes to finding the root cause if an issue arises, much less how it affects your customers. With Observe you can install the Kubernetes App to meet your K8’s observability needs AND pair it with other Apps to fill in the big picture when it comes to your environment.

Using the example above, simply install the Jenkins and OpenTelemetry Apps to answer more complex questions like “How did the latest release impact my application’s performance?”, rather than typical questions like “Is my site up?” that most third-party vendors are stuck at. You can even take this a step further by installing Zendesk integration to see not only when your customers were affected, but who was affected, and how.
And if you’re worried about the cost implications of ingesting data from dozens of sources, don’t. Observe’s unique architecture separates storage and compute to bring you flexible, usage-based pricing that lets you ingest as much data as you want. Once an App is configured data starts flowing into the Data Lake where it’s compressed 10x and then stored behind the scenes in Amazon S3 for 13 months by default. This means no more hard decisions about what data to keep and for how long. You only pay for the data you store at S3 costs, and then when you query it.
If you’d like to learn more about the Observability Cloud, check out the entire series here.
Or, if you’re ready to see how the Observability Cloud will change how you ingest, store, analyze, and visualize your observability data, click here to get access today!

