
Understand Business Impact with Reference Tables

New as of August 2025: Build reference tables by simply uploading a CSV through Add Data.
When an incident occurs, quickly understanding the business impact can be challenging. This difficulty stems from the fact that standard logs, metrics, and traces often lack essential business context, such as customer names, product names, prices, and other pertinent details. Most of this business context is typically located outside of EC2 instances or Kubernetes clusters.
Observe can accept various types of data, not limited to logs, metrics, or traces. You can send your customer list, product list, or a list of IP addresses to enrich your telemetry data. Many of our customers do this today to produce Resource datasets, which is great for short-lived associations like EC2 hosts or engineer-to-account mappings. However, since most of this business context doesn’t include specific timestamps, it needs to be refreshed periodically to prevent it from expiring in resource datasets. This is less optimal for long-lived associations like Product or Employee IDs.
Reference tables offer an easy way to integrate long-lived business context with machine data. In this blog post, I will use the OpenTelemetry Astronomy Shop and a reference table for products to demonstrate how quickly you can estimate revenue loss caused from a failing checkout service.
Collect events, logs and metrics from the Astronomy Shop
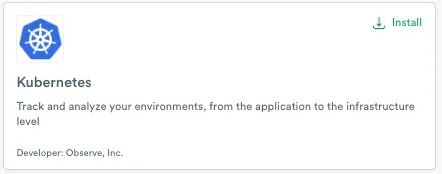
I already installed the Astronomy Shop in a 3-node GKE cluster by following the instructions here. I use the Observe Kubernetes App to collect events, logs, and metrics from the GKE cluster.
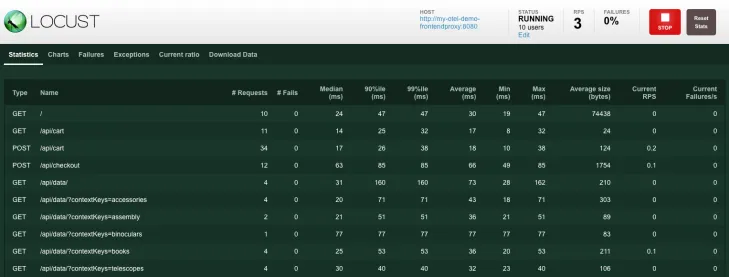
Once everything is up and running, you can go shopping at the Astronomy Shop (http://localhost:8080/) and add some items to carts and place orders a couple of times. To generate more meaningful traffic, use the Load Generator UI in the browser at http://localhost:8080/loadgen/

Once some meaningful traffic is generated, go to Log Explorer and locate the Container Logs dataset.
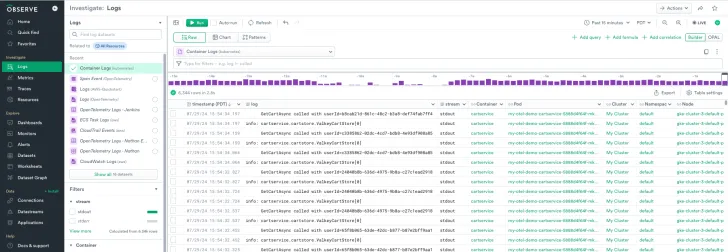
We are interested in logs from the cartservice container. Filter to the cartservice container using either the filter bar or the facet filter, and filter to log messages containing AddItemAsync.
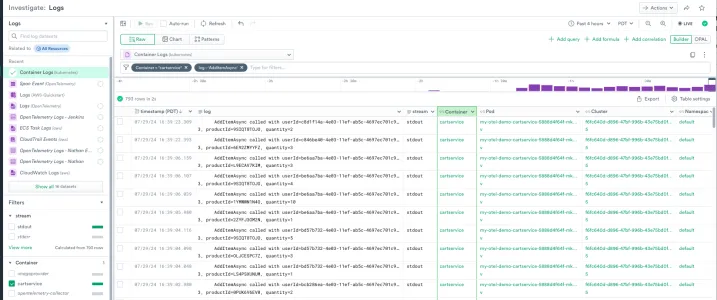
Looking at a log message, productId and quantity are interesting to us.
AddItemAsync called with userId=c8d1f14a-4e03-11ef-ab5c-4697ec701c93, productId=9SIQT8TOJO, quantity=2O11yGPT can help us generate a regex to extract productId and quantity from the log messages.

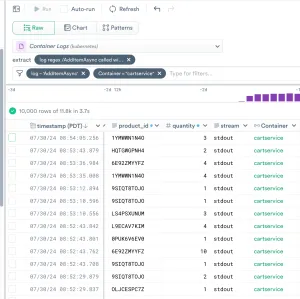
product_id and quantity are useful, but having product names and prices would provide more meaningful insights. Typically, this information is not available in raw logs.
Create and use a reference table called Products
This is where reference tables come into play. We can create a reference table from a CSV file and its schema in JSON, which have been converted from the Astronomy Shop’s product catalog. To create a reference table, you first need to generate an authentication token using these steps. If you have integrated Observe with a supported SSO provider, you can generate an auth token using cURL by following these steps.
Once you have the authentication token, you can use the following API to create a reference table called Products.
# Create a reference table with name, primary key, and its schema
curl 'https://{customerid}.observeinc.com/v1/referencetables' \
-X POST \
-H 'Authorization: Bearer <customer id> <token>' \
-F 'metadata={"label": "<name>", "primaryKey": ["col1", "col2", "col3"], "labelField": "col2"}' \
-F 'upload=@<path to csv>' \
-F 'schema=@<path to schema json>'
The following example creates a reference table called Products with a primary key, id and a schema in JSON representing the schema of the csv file above.
curl 'https://123456789.observeinc.com/v1/referencetables' \
-X POST \
-H 'Authorization: Bearer 123456789 sB_pLWTM0ED_redacted' \
-F 'metadata={"label": "Products", "primaryKey": ["id"]}' \
-F 'upload=@products.csv' \
-F 'schema=@products_schema.json'
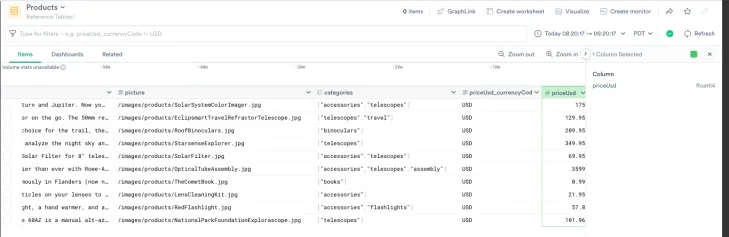
{"id":"41941674","customerId":"123456789","workspaceId":"41139097","label":"Products","datasetId":"41941673","folderId":"0","createdBy":{"id":2896},"createdDate":"2025-02-07T19:12:36.157153Z","updatedBy":{"id":2896},"updatedDate":"2025-02-07T19:12:36.157153Z","checksum":"b26f8dc7102f33a1ea9dd81723ee53b7"}Go to the dataset page and search for Products. You will see the `Products` dataset under the Reference Tables/ namespace.
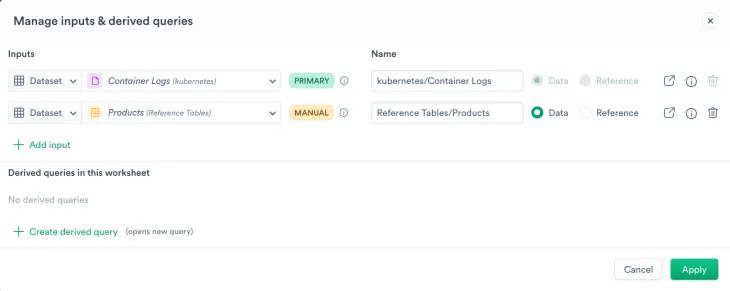
We are now ready to add meaningful product names, prices, and calculate the impacted revenue. Return to the Container Logs dataset in Log Explore and open it in the worksheet. Use the Manage inputs option to include the Products dataset.
Use the following lookup command to enrich the container logs with product names and prices from the reference table called Products, and calculate the potentially impacted revenue.
lookup on(product_id = @"Reference Tables/Products".id), productName:@"Reference Tables/Products".name, productPrice:@"Reference Tables/Products".priceUsd
make_col impactedRevenue:round(productPrice*quantity,2)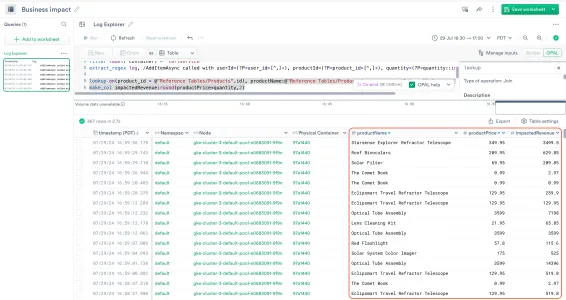
Understand business impact
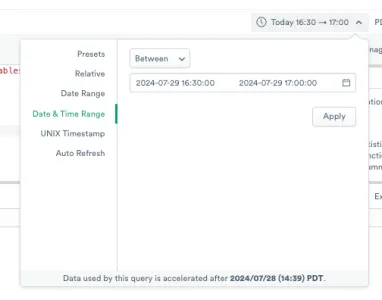
Let’s suppose we had an incident that made the checkout service unavailable for 30 minutes from 2024-07-29 16:30 to 17:00 (PDT), and items that had been added to carts were abandoned. With the enriched Container Logs dataset, we can quickly calculate the revenue loss caused by this incident. Pick the relevant time range in the time picker.
The following OPAL command suggests that we lost about $923,506.
statsby impactedRevenue_sum:round(sum(impactedRevenue),2), group_by()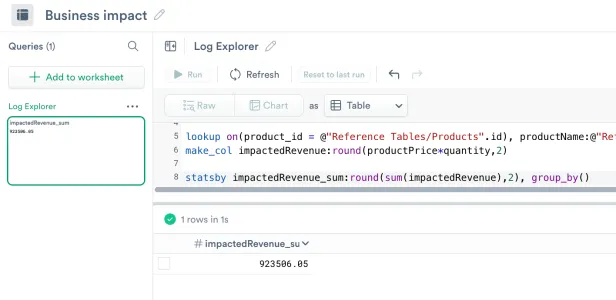
We can also check the revenue impact by product as well.
statsby impactedRevenue_sum:round(sum(impactedRevenue),2), group_by(productName)
sort desc(impactedRevenue_sum)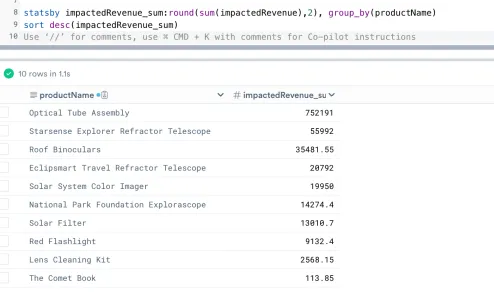
We just went through a hypothetical incident at the Astronomy Shop and saw how a reference table helps us quickly understand the business impact caused by the incident. Please try out the reference tables by using Observe docs, API reference, and Terraform, and share your feedback with us. Come take Observe for a spin yourself with a free trial!
