Observing AI
Anyone building, deploying, and serving AI-powered applications in production will run into a number of new challenges in observability, and traditional RED metrics won’t help solve the problem.
At Observe, we have two main AI-powered features: O11y GPT Help, which lets you ask questions and find answers about how to use Observe and integrate it with your systems, and O11y Co-Pilot, which helps you write specific query code to analyze your data. (O11y is the name of our mascot, the Observability Robot, and that robot has become the face of all our AI-powered features.)
This post shows how we use Observe to answer AI observability questions that other tools will struggle to answer.
The AI Observability Challenge
Our applications use many of the currently most cutting-edge AI technologies to enhance user experiences and boost efficiency. We use:
- vector databases for similarity search to power retrieval-augmented generation
- long text summarization to generate situation reports for our incident management integrations
- automatic and manual collection and curation of training data sets
- custom AI model training and hosting to generate suggestions for code completion to construct queries
- third parties like OpenAI for hosted inference tasks.
To answer “how is AI doing?” we need more than just “there’s a less than 1% number of 500 status codes, and inferences are running between 500 and 1500 milliseconds” that we get out of a traditional service monitoring solution, although clearly those types of numbers are useful for “quick eyeball” health checks. We also need deeper insight into the execution of the system, beyond just “web service A called function B that called service proxy C that forwarded request to external vendor D” tracing flame charts, even though those charts are a good start for many diagnosis workflows. Finally, typical web server logs may include some information about the session or network flow, but will not be able to answer the question “how many inference tokens did this query consume?” or “what is the quality of the responses of our AI model?”
To know whether the application has value to our customers, we need to tie the questions asked by our customers to the results they get, and get some measure of the quality of those answers. We also need to go all the way from “collecting data” through “curating data sets” to “evaluate runtime performance of generated inference – do people accept what we suggest?”
At Observe, we use a combination of capturing full service payloads, using instrumented tracing, and adding informational structured logging to build a full view of how our system performs. As each AI application is fairly unique, there’s no good standardized interface for these things. To solve this problem we use the semi-structured data support and data modeling of Observe’s own OPAL to build the analytics products we need to observe our applications. Now we can monitor and maintain our AI products; and because it’s built on top of Observe, we get these insights streaming, in real time!
Observe AI Architecture

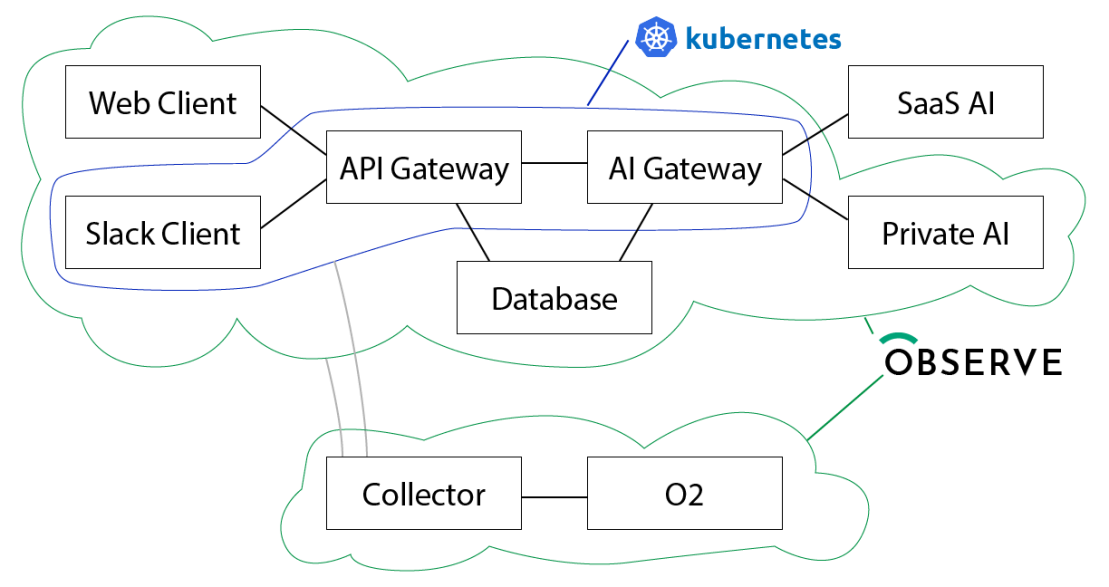
This is a simplified architecture diagram – forward/reverse proxies and network infrastructure is hidden.
- The Web Client is a TypeScript web application written in React, and we largely use manually emitted events (plain JSON payloads) to do user session instrumentation, as well as Open Telemetry tracing.
- The Slack Client is a Python application which uses some Python instrumentation, and also a lot of structured logging, where we log Python dicts as JSON payloads.
- The API Gateway uses both Open Telemetry tracing, Prometheus metrics, and structured logging, mainly using key=value payloads rather than JSON.
The AI Gateway uses instrumentation similar to the API Gateway. It also emits full copies of all AI inference payloads and results into the logging event stream, as JSON. - The Database is hosted in Amazon Web Services and we get logs from AWS.
- The SaaS AI is largely OpenAI hosted API services, and doesn’t give us direct observability, but the full capture of payloads and results in the gateway lets us correlate the behavior of this endpoint.
- The Private AI are servers running inference on H100 GPUs on Linux, and use the Observe Host Monitoring application with Prometheus and Fluent-bit data, as well as structured logging using Python dict-as-JSON.
- The Collector is our powerful ingest pipeline, which gets data into the system at speed and scale.
- O2 is the “observing Observe” tenant that we use to observe our own services (although on a separate set of infrastructure, so we can debug infrastructure failures…)
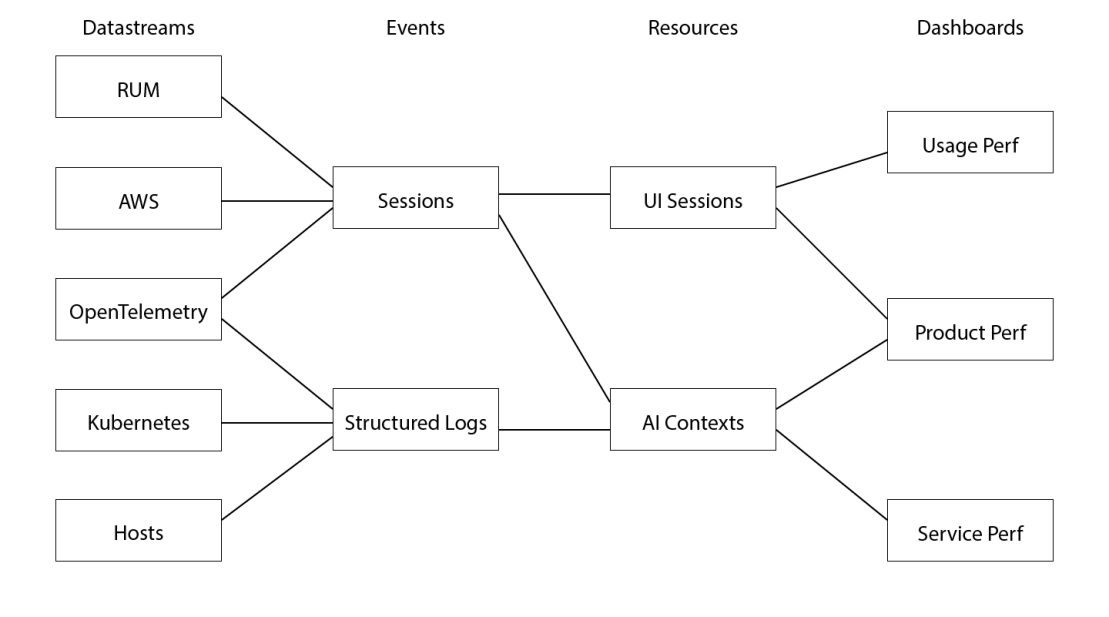
The different services end up sending data to different datastreams depending on the path the data takes, and that’s OK – we can join and correlate them later!
Observe AI Datasets

Real User Metrics (RUM) is a datastream dedicated to measuring how our web application is doing in the browser. This organizes data based on a session ID attribute. All instrumentation for this application goes into the same datastream, so events specific to the AI feature behavior are filtered into the Sessions event dataset, where it is also unioned with similarly selected data from the AWS database and OpenTelemetry.
We build a UI Sessions resource from these Sessions events, in which each user session’s overall behavior can be easily isolated and analyzed. We’ve chosen to not use month-long OpenTelemetry traces, but instead use traces for individual page loads and sessions, and we correlate the longer context (for example, a help chat thread of back-and-forth questions and answers) using a separately allocated unique help session id.
Events from the AI-related services hosted in both Linux hosts and Kubernetes containers, as well as from Open Telemetry, similarly get filtered into a Structured Logs dataset that contains all of the relevant log data for the lower-level AI Context analysis. We also extract events from the user-driven data when a user uses “thumbs up” or “thumbs down” on some particular help interaction into this datastream, to give engineers the ability to correlate everything top-to-bottom.
Finally, we report with three different kinds of dashboard cards: Usage performance (metrics such as “daily active users,”, or any other adoption or engagement metric we want to track), Feature performance (insight into behavior like “proportion of positive/negative interactions”), and Service performance (low-level data like latency, cost, and error rates.). This lets us do interesting analysis such as checking whether we get more negatively rated interactions when the upstream services are having trouble and whether our in-lab predictions hold when real users interact with features. If there is any particular data point that sticks out, it’s straightforward to get a slice of all data in the system related to that data point. Because Observe does generic joins, and doesn’t pre-determine tags, we can also run queries like “number of inference tokens consumed by customer” or “users with the most positive/negative feedback.” The Observability Data Lake pulls its weight, every day!
Use Cases for AI Observability
A product manager trying to understand what to focus on in product development, will use this observability differently from an engineer trying to figure out why a particular kind of request may be failing. On the other hand, a data scientist will want to use this observability to understand how the model performance can be improved, both in terms of latency and quality of the answers – for example figuring out whether using a smaller context could still allow us to achieve good results while decreasing the latency (which will improve the experience of the feature).
The product manager will look at the list of all questions and answers, and pay special attention to the answers with lowest ratings. (It would be great to celebrate successes on a daily basis, but let’s be real: Continual improvement is what building a product is all about!) The PM can see in session history whether the error came on a question early in a chat session, or late. The PM can also look to see which pieces of documentation were augmenting the prompt for the LLM, to see whether certain questions may retrieve the wrong documentation, or whether there are areas of our documentation that need more attention. Most importantly, per-feature MAU can be evaluated over time to see how successful a given idea is in the real world.
The software engineer will look at the latencies and error codes. Frequently, some bug report will contain a specific piece of text or error message that is easily identified, although we will often look at failures without a bug report, because we funnel the behavior of all our systems (development/testing, staging/qualification, and production/release) into the same set of dashboards, with parameters for which environments to include, and whether to look at Observe-internal usage or actual-customer usage. For example, when a particular kind of request reports a lot of 400 failure errors, the engineer will frequently dive into those by looking at the correlating events in the structured logs, to see what area of the code generates the problem, and what kind of data causes it.
The data scientist needs to understand how the model is actually behaving at the lower level. Which models have better performance for which kinds of queries, how selective should we be when including context for RAG, are there particular keywords that confuse the model, and so on. This is a lot of qualitative work, which is made fast and simple by queries running on accelerated (materialized) datasets that focus on exactly the kind of data and queries we run.
The World is Complex
The diagrams above are simplified – for example, we actually have an Observe langchain plugin, which can emit trace-like events from an application build with that platform and we extract logs from the API of Weights and Biases for our training data curation and and experiment tracking data.
We also have more general purpose instrumentation that assists in not only AI applications, but overall running of Observe. Whenever there is an error code returned to a user, our infrastructure generates a stack trace of where it came from, assigns that to a fault source “bin,” and opens a bug in JIRA with the error and location. If the bug already exists, this additional error is added as a comment so we can find more instances of the same thing. This kind of home-grown observability is a huge driver of engineering efficiency, and having everything we need at our fingertips in the Observe platform makes building these kinds of improvements easy and delightful.
Brass Tacks
Common to almost all of these integrations, is that they use facilities that are already available. Posting RUM from the web app uses a simple browser `fetch()` request, sending some JSON to a datastream. Emitting structured log events from the API server is as easy as logging some `key=value` pairs to the standard log stream. And analyzing the full payload of remote API requests is no harder than printing JSON data to stdout.
Example Events
Go
// example Go structured event
glog.V(3).Infof("msg=new-id customerId=%v userId=%v id=%v session=%v",
    customerId, userId, newId, sessionId)
Python
# example Python structured event
logger.info(json.dumps({'url':target_url, 'session':session_id,
    'request':out_request}))
Browser
// Example browser structured event – typically, you’ll wrap this in
// a helper on top of fetch() to make calling it a one-liner.
fetch(`https://${customerId}.collect.observeinc.com/v1/http/rum-data`, {
  method: 'POST',
  headers: {
    'authorization': `Bearer ${customerId} ${rumAuthToken}`,
    'content-type': 'application/json'
  },
  body: { // the payload has no particular schema, capture what you need!
    myUserId: myUserId,
    myEvent: 'some-event-name',
    myParameters: {}
  }
});
Observe uses standard observability forwarders – fluent-bit, prometheus, open-telemetry, and also many others – to capture the data with a minimum of up-front processing, instead capturing it all, and using schema-on-read to discover, extract, and use all the rich information found therein.
If your log message doesn’t have a timestamp, that’s OK, too – the collector will add one as soon as it makes it to the endpoint. If you do capture a timestamp inside the payload, that can be used, too.
Want to see how it works? Check out a demo or a trial today!

