Observability at Observe – Modeling our Business as a Data Graph
Observe provides a highly scalable and available Observability Cloud to customers worldwide, allowing teams to build, run, deploy, and monitor their software at internet scale. Observe charter is to provide our users with useful insights from their seemingly disparate and never-ending mounds of machine and user data.
To run this platform at scale, Observe uses its own offering to monitor itself. We call that “Observe on Observe” or O2 for short. Self-hosting our stack and validating everything makes a big difference to the quality of our customer offering.
In the first part of the series, we described Observe architecture and explained various use cases for self-monitoring that we use the O2 tenant for.
In this part of the series, we explain how Observe combines performance and business data into an interactive, connected map that we call the Data Graph, and how our engineers and product managers use it to manage performance, features and costs.
In the third part of the series, we’ll explore some of the more technical aspects of keeping Observe running smoothly, including tracking user activity, monitoring our service provider Snowflake, ensuring the health of data transformations and other aspects of engineering and business observability.
In the fourth part of the series, we’ll describe the recent optimizations of the Observe on Observe environment that improve the platform performance and decrease operational expenditures.
Enrich and Connect Business and Infrastructure Data
At the core of our platform is the ease of bringing arbitrary data together to be analyzed. We send the streams of various events to O2, clean and enrich the data, then link it all together into a Data Graph, which consists of Datasets curated from the Data Lake to make it easier to navigate and faster to query. Datasets represent “things” that users want to ask questions about. They can be business-related, such as customers and shopping carts, or infrastructure-related, such as pods, containers, and S3 buckets.
Here is an example of a lineage graph of what we build from data emitted by code running in Kubernetes:
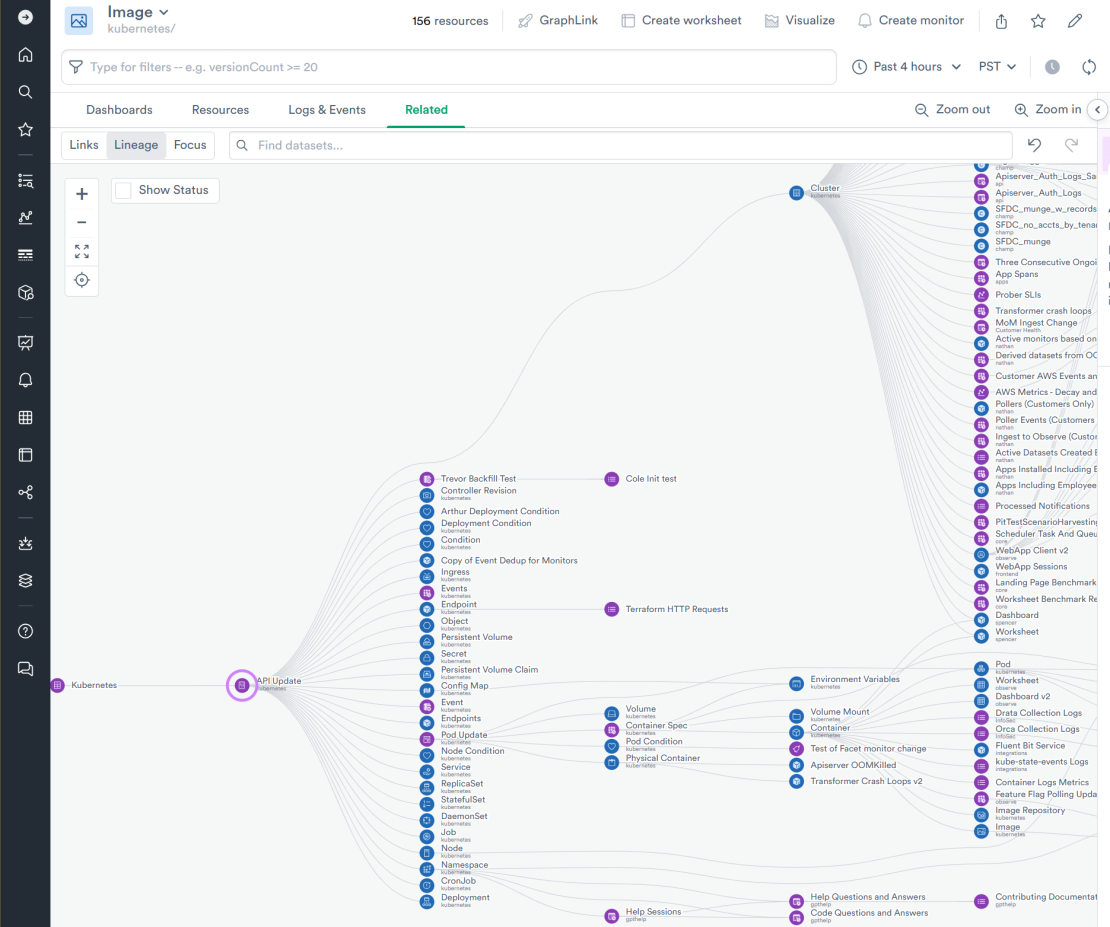
The 3 well-known pillars of observability (metrics, traces, and logs) provide the raw materials that we use to build the O2’s Data Graph. For example, O2 takes a log line or a trace emitted by a piece of Observe code and adds to it the container information that hosted the executable, the Kubernetes cluster, node and pod that ran this container and the cloud provider infrastructure that hosts the Kubernetes cluster.
O2 also has information from our source control repository and CI/CD system. O2 further enriches the log line with the container information, image metadata and the code check-in/pull requests that produced the code and its containing image.
Observe logging/tracing code includes customer, user and the business context of what the user was doing – such as querying the data, graphing a metric, building a monitor, or building a dashboard. That information is added to the structured logging and to trace attributes.
These additional dimensions enable incredibly granular and multivariate queries for performance investigation, application impact study or customer usage analysis.
Building Connections as Data Graph
Let’s take a look at some of the core components of the data model that powers management of Observe infrastructure in O2.
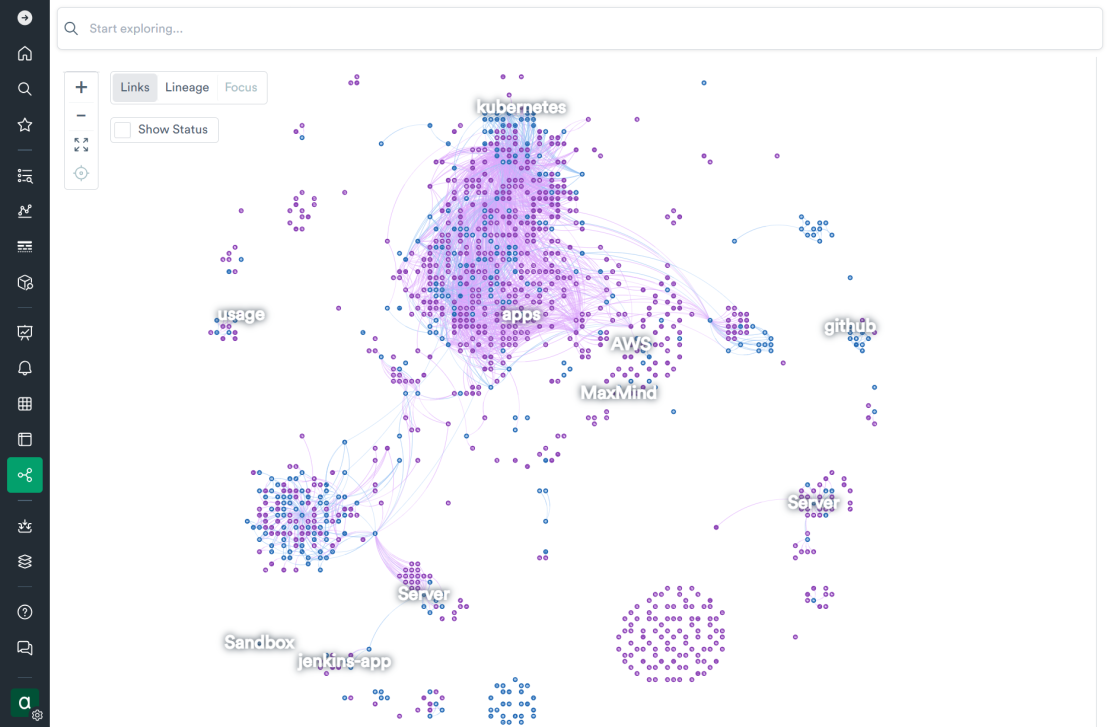
The Data Graph view of O2 shows relationships between the datasets in the overall connection of the system. Datasets are much like tables in a database. They consist of rows and columns of specific types. They can be linked, aggregated, and joined to enrich the data at scale, and queried individually or in any combination with one another using joins.
Viewed from very high up, the relationships and connections between clouds of related, linked datasets in the O2 data model are immediately visible:
Many central, core components in O2 are contained in the “observe” package, including strongly typed and carefully configured datasets representing Customer, User, Dataset, Dashboard, Feature Flag, User Query, Snowflake Query, Table and many other entities that our engineers care about:
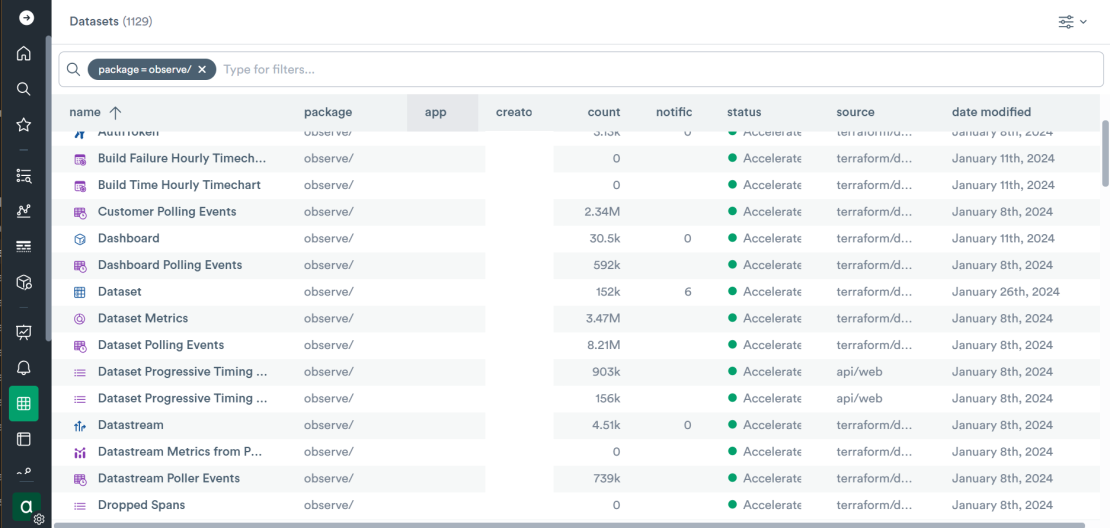
The modeling process begins by looking at the data and figuring out the information that needs to be extracted from it to make useful business decisions. Over years, much careful thought went into defining each of these entities and how they connect to each other. But the model isn’t set in stone. As new features develop and requirements change, the model is always evolving. Observe’s schema-on-demand capability allows for rapid changes that propagate through the connected ecosystem of datasets in O2.
Tracking Customer Datasets
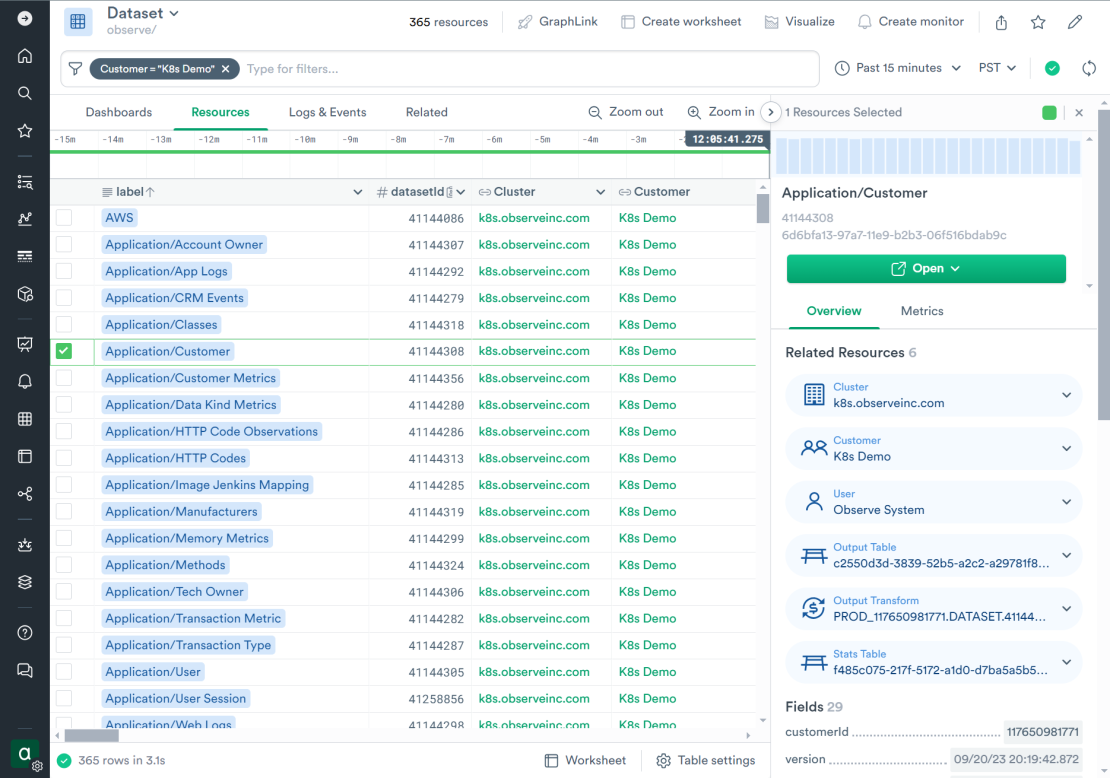
The “observe/Dataset” is a resource dataset (entity that has permanence over time and tracks the state changes) where each row represents a dataset in some customer’s Observe tenant. The dense spider web of connections on the “Related” tab of this dataset shows just how strongly “observe/Dataset” is connected to other components in O2:
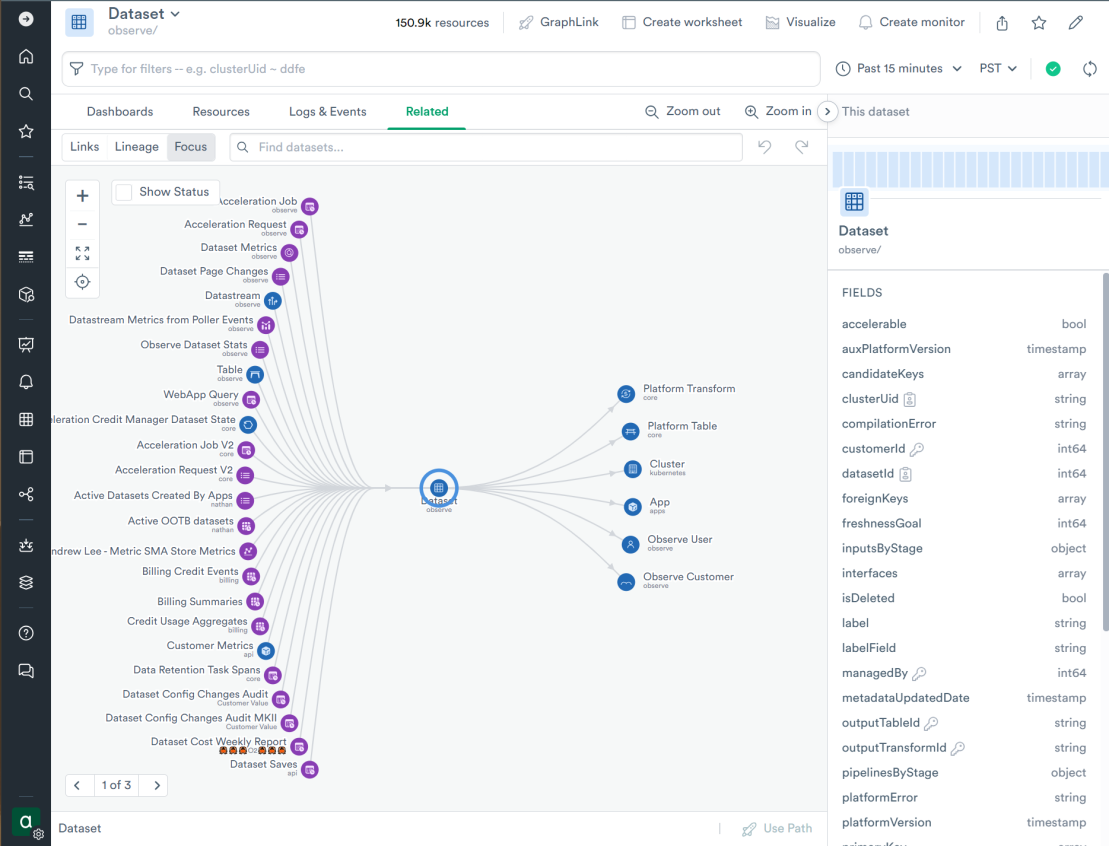
The “observe/Dataset” dataset represents customer-managed entities as a record in a table, keeping track of history and configuration changes. The record is identified by a primary key (Observe deployment, Observe customer and dataset ID) and includes the configuration logic in Observe Processing and Analysis Language (OPAL):
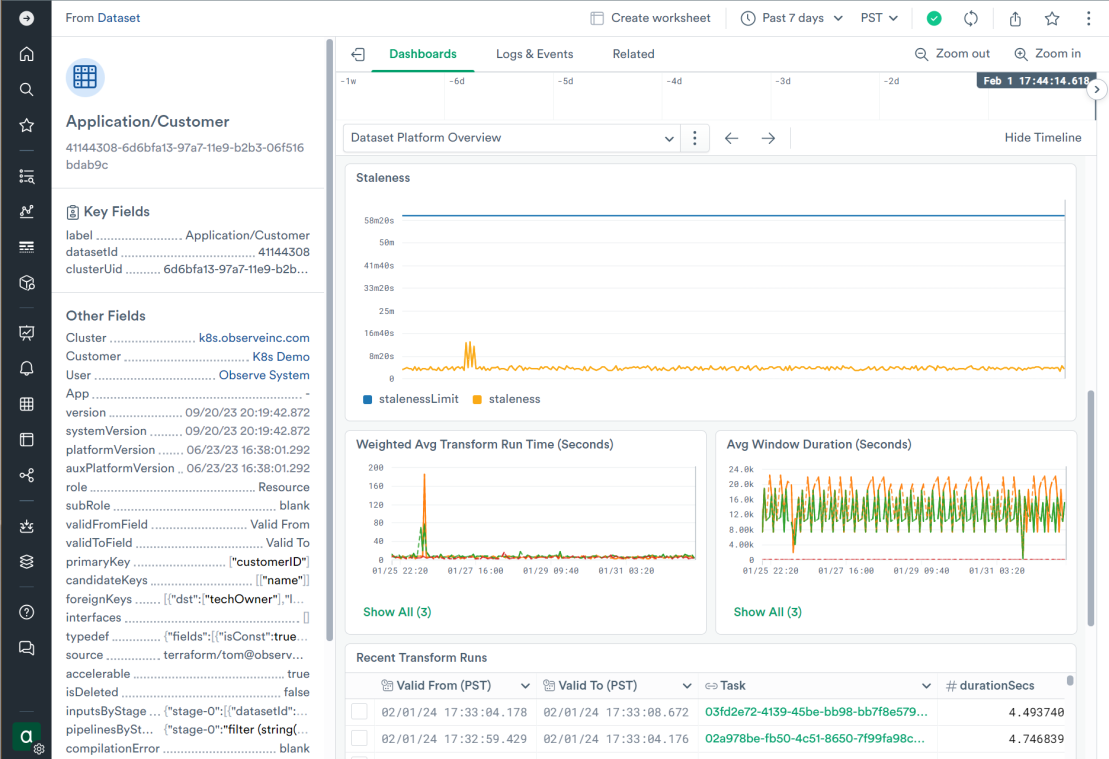
All resource datasets in Observe can have custom dashboards associated with them. The “observe/Dataset” dashboard shows statistics about the acceleration jobs that keep this dataset up to date and displays relationships to upstream and downstream datasets. Engineers use this dashboard to understand and troubleshoot the dataset without seeing any data in it, which remains safely under customer control:
Managing Customer Features
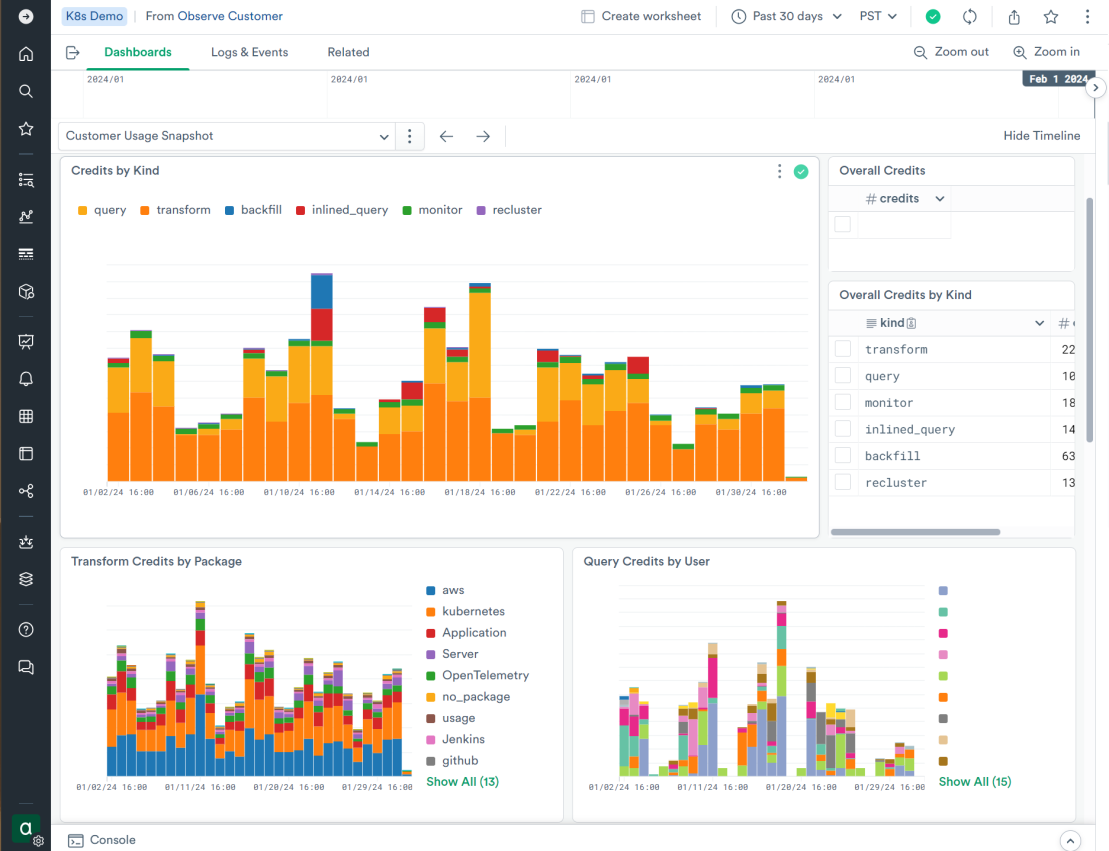
Similarly, the “observe/Observe Customer” dataset tracks every customer of Observe. The default dashboard for the customer record in this dataset focuses on credit usage. Customers themselves can see much of this using the Usage Dashboard in their own Observe deployment. The dashboard in O2 provides a bit more detail for Observe engineers:
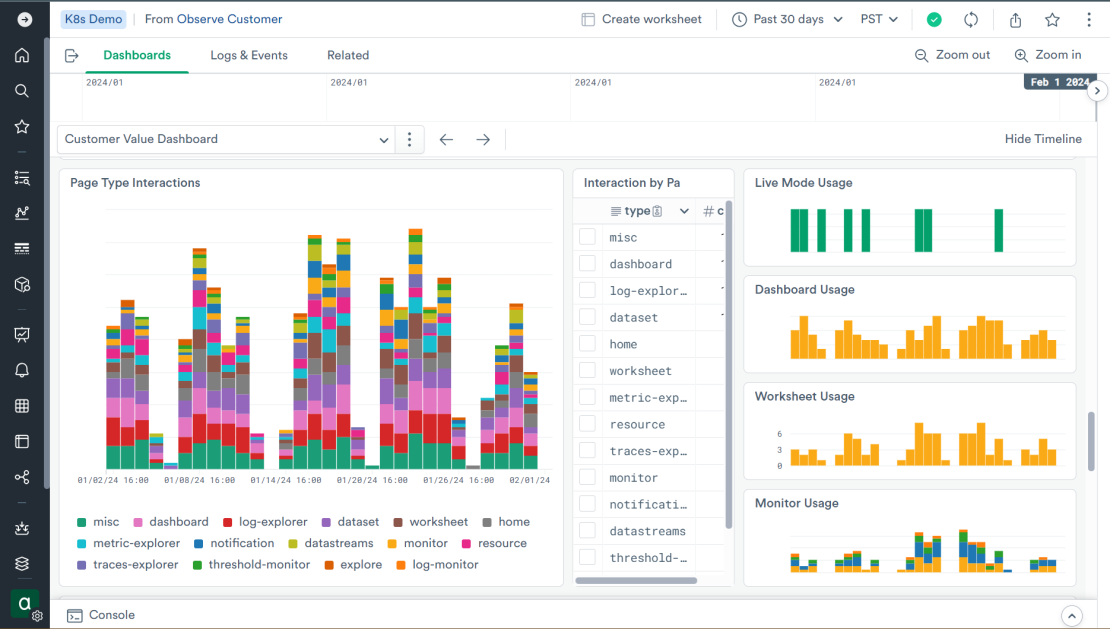
The “observe/Observe Customer” dataset other dashboards focus on different views into the customer data. For example, “Customer Value Dashboard” is used by the field engineers to explore our customers’ usage of various product features, categorizing activities by the product component being used (such as dashboards, exploring logs, ad-hoc queries with worksheets, building monitors and so on):
Analyzing Usage of Product
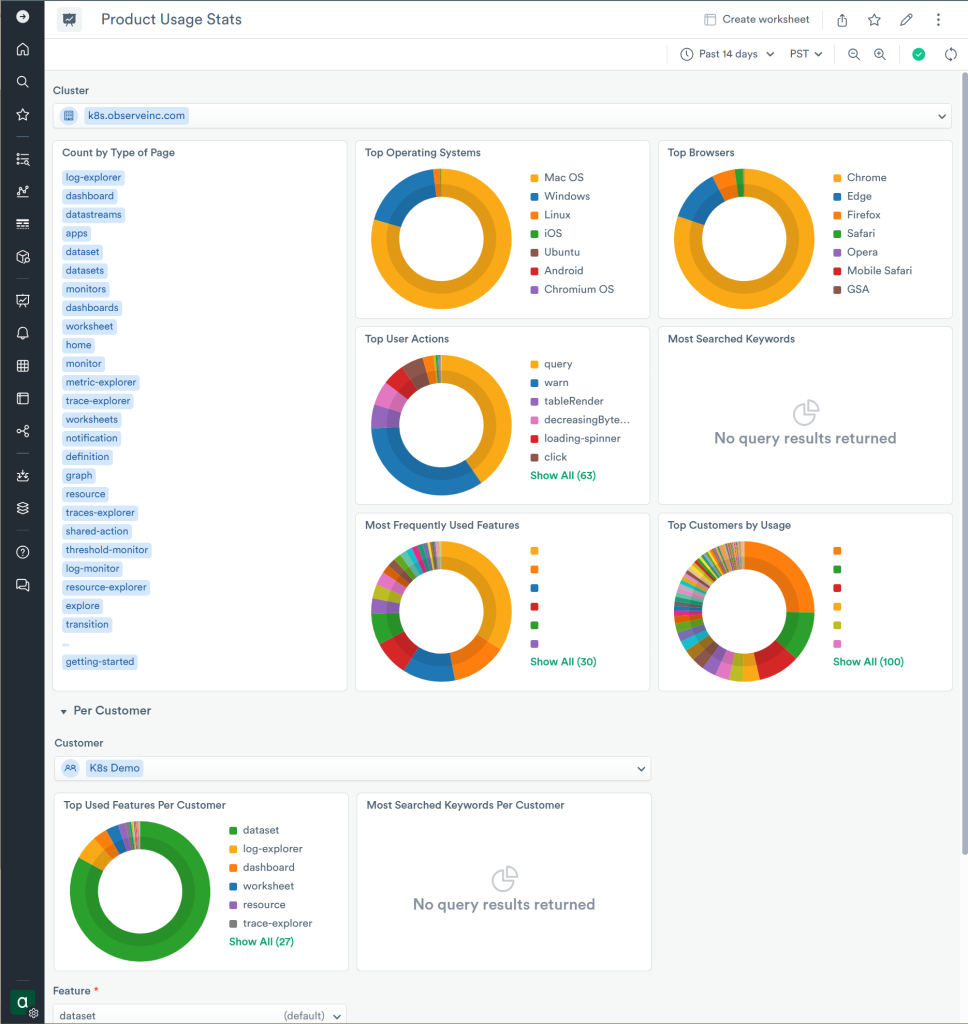
Product managers on the Observe engineering team use O2 to gain insights into product usage, track feature adoption, review what kinds of data customers send to Observe, how it is accelerated and what they query. These investigations in O2 inform future product direction and investment into right-sizing of our product infrastructure.
The “Product Usage Stats” dashboard is a great example of one such dashboard focusing on major components of Observe product:
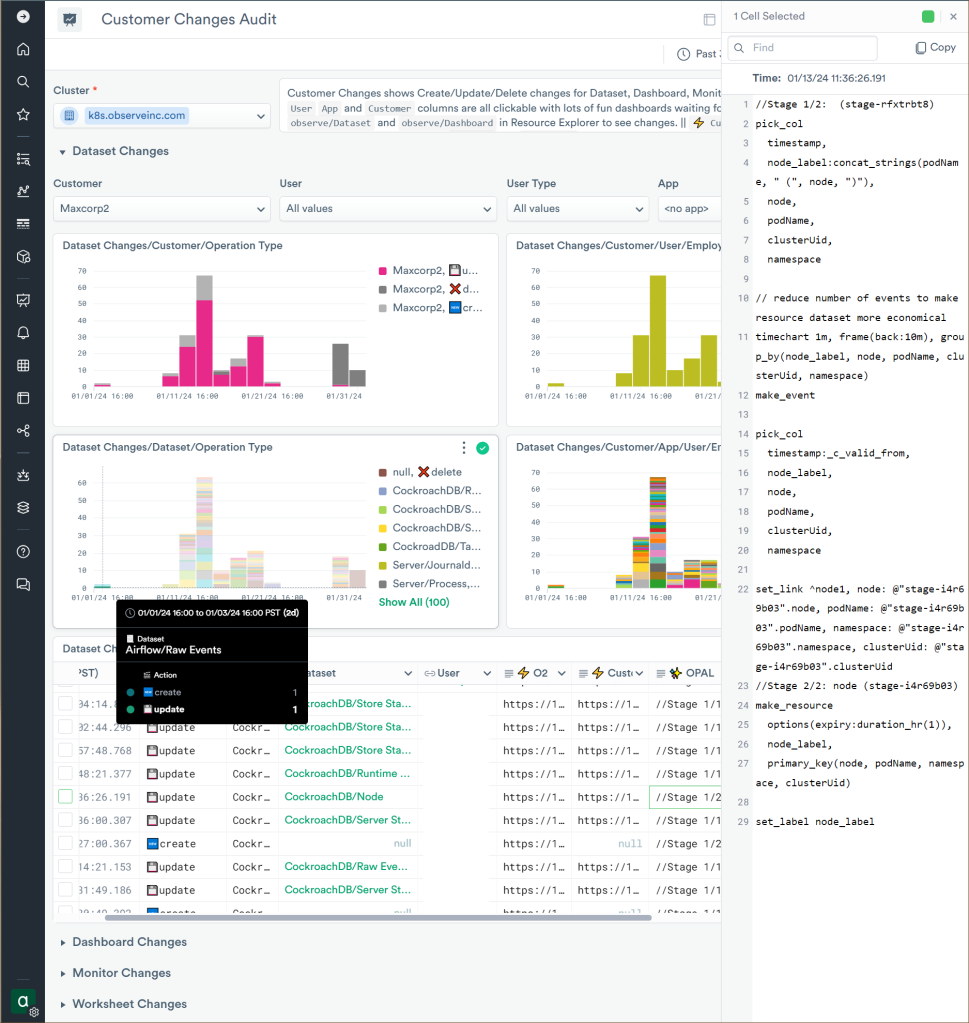
The “Customer Changes Audit” dashboard in O2 allows users see the changes the customer make to the logic of Observe entities such as datasets, dashboards, monitors and worksheets:
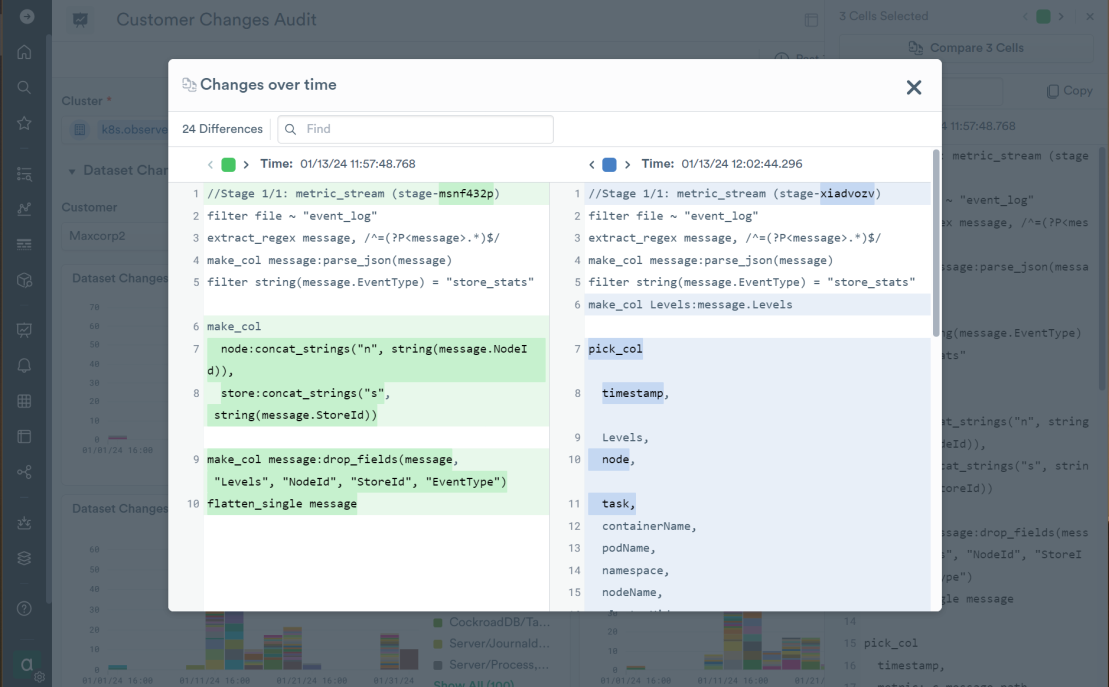
Those changes to Observe entities can be further analyzed in the “changes over time” dialog, allowing our engineers see configuration evolve from version to version:
Conclusion
Managed solutions live and die by their quality and uptime. Quality and uptime are directly related to what you can measure and how you manage it. To measure something you have to observe it.
Observe provides a highly available, immensely configurable, easy to use observability solution to our customers. The self-usage of the product offers great visibility into technical and product usage details to product engineering and product management. At the same time, it contains a wealth of useful data on customer usage for our field engineering and sales teams.
Modeling business data into clean, rich and connected data graph in the large-scale data lake enables Observe to perform complex multivariate analysis for any kind of performance or business investigations. Logical connections between various entities enable easy data discovery and intuitive navigation between various aspects of the O2 data model.
Up Next
Read on to the third part, where we will explore some of the more technical aspects of keeping Observe running smoothly, including tracking user activity, monitoring our service provider Snowflake, ensuring the health of data transformations and other aspects of engineering and business monitoring. If you’d like to try it yourself, Observe’s Free Trial is only a click away!

