Observability at Observe – Optimizing Usage and Costs
Observe provides a highly scalable and available Observability Cloud to customers worldwide, allowing teams to build, run, deploy, and monitor their software at internet scale. Observe charter is to provide our users with useful insights from their seemingly disparate and never-ending mounds of machine and user data.
To run this platform at scale, Observe uses its own offering to monitor itself. We call that “Observe on Observe” or O2 for short. Self-hosting our stack and validating everything makes a big difference to the quality of our customer offering.
In the first part of the series, we described Observe architecture and explained various use cases for self-monitoring that we use the O2 tenant for.
In the second part, we explained how Observe combines performance and business data into an interactive, connected map that we call the Data Graph, and how our engineers and product managers use it to manage performance, features and costs.
In the third part of the series, we explored some of the more technical aspects of keeping Observe running smoothly, including tracking user activity, monitoring our service provider Snowflake, ensuring the health of data transformations and other aspects of engineering and business oversight.
And now in the fourth and final part, we will describe recent optimizations of the Observe on Observe environment that improve the platform performance and decrease operational expenditures.
Focus on Efficiency
We strive to use Observe O2 both effectively and efficiently. Like any powerful and multi-purpose machine, it requires some regular attention and maintenance.
During a recent engineering epic, our engineering team focused on auditing and optimization of what we have in O2 with dual goals of increasing quality of data and reducing cost.
The results were very impactful to both our bottom line and to improvements for our customers. Let’s dig into what we did!
Tracking Datasets Usage and Dependencies
To begin with, we categorized the sources and purpose of each dataset in O2.
For example, the “core/Snowflake GS Stats” dataset is produced from a stream of OpenTelemetry traces and logs from Kubernetes containers, and is used by 3 user dashboards and 2 important monitors:

It was immediately obvious that many datasets in O2 were no longer necessary. Some were created for a purpose that was no longer valid, some were abandoned by their users, and some were used so rarely that it wasn’t worth spending computational power on the ongoing accelerations when they could be converted into ad-hoc queries.
Observe is already great at dealing with data that isn’t being queried, but nothing beats deleting unused stuff! Deletion of those datasets immediately freed up resources for more productive uses elsewhere.
We looked at who was querying the datasets. We quickly found many possible optimizations, such as an automated process running integration tests with overly aggressive scheduled querying of a major internal dataset. Reducing integration tests frequency reduced daily compute costs.
Optimizing Logging and Reducing Verbosity
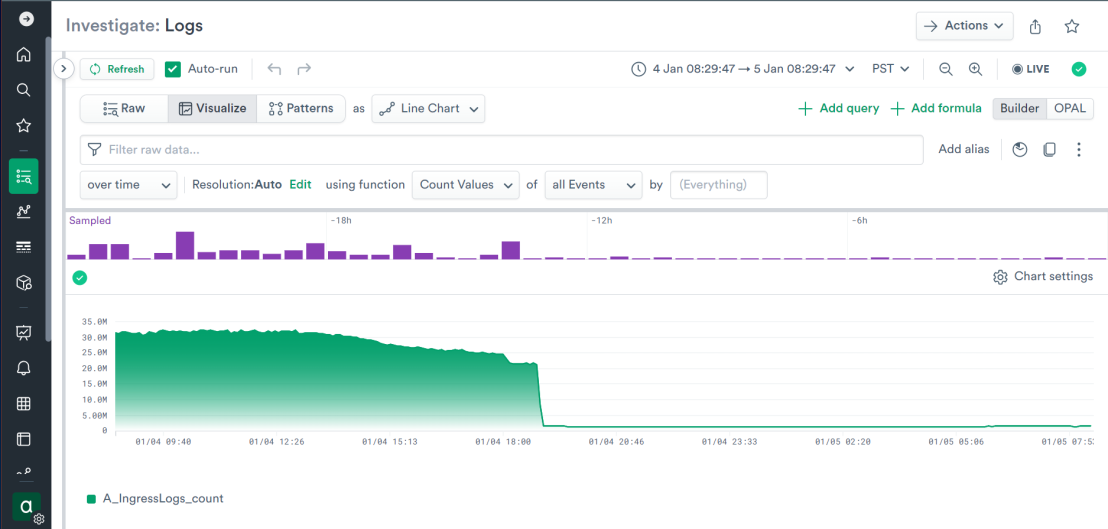
We compared the value of the data in datasets against the cost of building them. One of the largest by volume and costs was our data ingress log dataset. After careful evaluation of what was logged, we realized that it could be sampled down severely and still yield a valid signal. We don’t have to sample data in Observe, but we’ll certainly use the technique if it makes sense for a given use case. After pruning most of the incoming messages, the costs were much reduced:

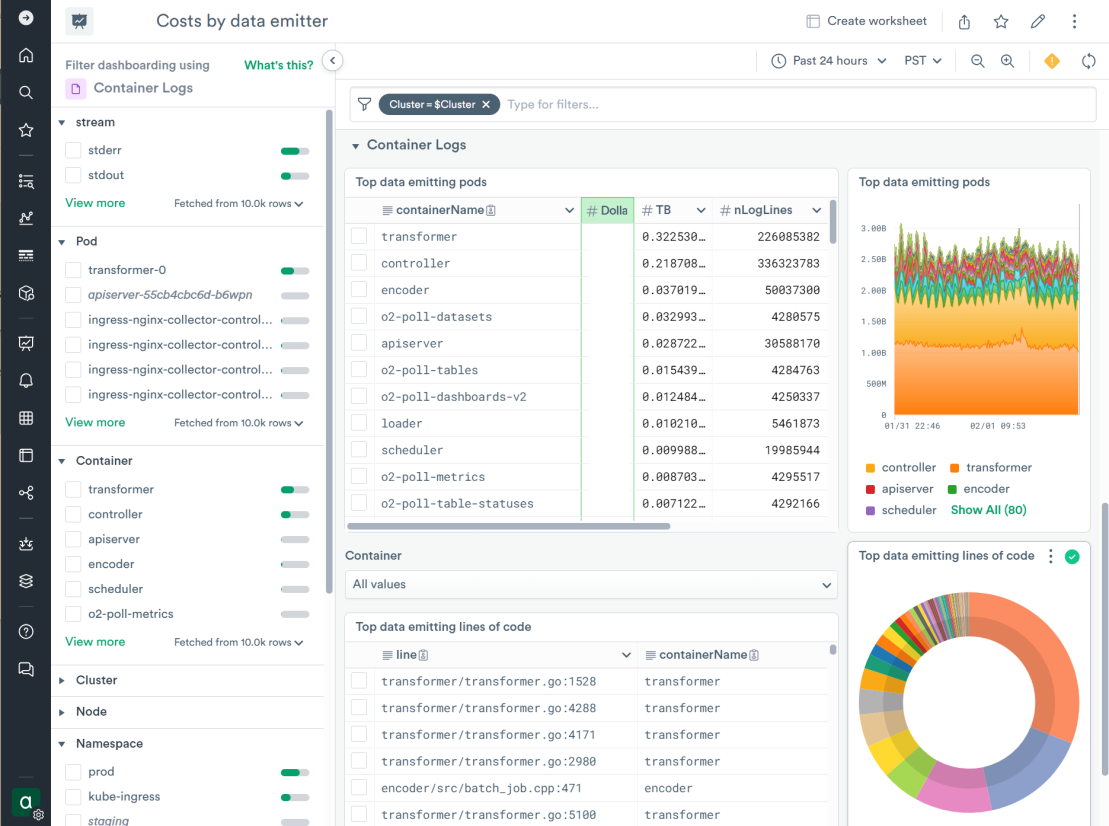
One of our engineers built a dashboard to analyze the log messages logged into the main Kubernetes logs dataset with estimates of their cumulative size and costs associated with accelerating them. This awareness drove improvements in the logging output in some of our components:

And using that dashboard, we quickly discovered that one of the collector components was recently set to a high verbosity logging mode for an investigation and left in that state. Having debug messages flood the logs for a long time is not very useful. We quickly turned it off which reduced the incoming log volume from that component by ~40% without losing any signal.
Tuning Dataset Freshness and Logic
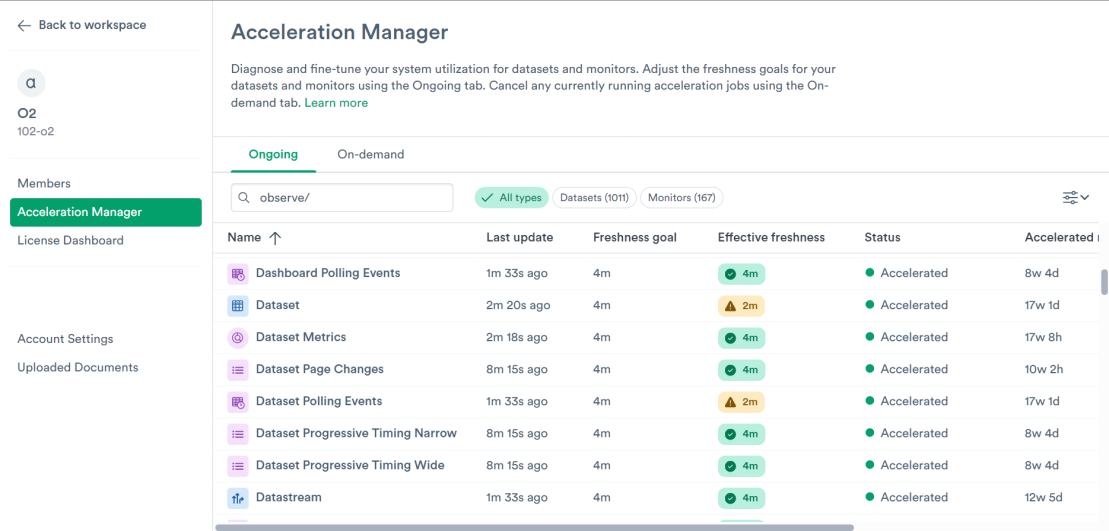
For the datasets that were clearly useful but could stand to be slightly behind in time, we used the Acceleration Manager to relax the “freshness goal” setting. A tighter freshness goal asks the platform to perform these updates more frequently to keep data fresher and more up-to-date, and a looser freshness goal allows the platform to perform these updates on a slower schedule. The adjustment of setting allows for a trade-off between the freshness of data in these datasets and the cost of accelerating queries on them.
For most datasets, doubling the most common setting of 2 minutes to 4 minutes was enough for a noticeable reduction in compute costs at a negligible impact to end users:

After all these configuration changes, we still had some remaining datasets that were deemed a bit expensive to maintain. For those, we took steps to revisit the logic that builds them. Many were optimized with better-performing OPAL logic and rebuilt in a more cost-effective configuration.
Optimizing Snowflake Job Scheduling and Virtual Warehouses
Our resource optimization team used O2 to analyze the Observe task scheduler history and Snowflake query history to optimize our Snowflake virtual warehouse allocation and task placement for both O2 and our production tenants. This resulted in code changes to the scheduling logic that increased virtual warehouse utilization, realizing a 10% to 15% reduction of Snowflake costs without significant changes to data freshness and query tail latencies.
We applied some changes to the ad-hoc query behavior that traded slightly increased queuing times for higher utilization of the warehouses (i.e. shoving more queries into virtual warehouses when enough queries accumulate to pack it as full as possible). The impact on latency was minimal but it brought down costs of ad-hoc query behavior by 20-30%.
Another outcome of that analysis was the realization that we had over-provisioned the Snowflake virtual warehouses responsible for ongoing data load into O2. We reduced the size of virtual warehouses, which didn’t significantly affect end-to-end latency but certainly had a perceptible impact on the costs.
As part of the cleanup, we removed the obsolete Observe accounts that were part of previous integration testing or expired trials, further reducing the amount of data sent to O2.
Optimizing Parallelism for Multi-Datastream Data Inserts
We noticed that some inserts of the data sent to O2 were taking longer than we would like. O2 has basically one big volume datastream and a bunch of small ones and the insert logic would combine inserts from ~8 datastreams together, touching many tables in the same transaction.
To try and improve that, we made a config change to force more parallelism, by telling the loader to not merge inserts together if their size is above a certain threshold. Now the records from large volume datastream would be inserted on its own, while smaller-sized inserts would continue to be merged in a single transaction.
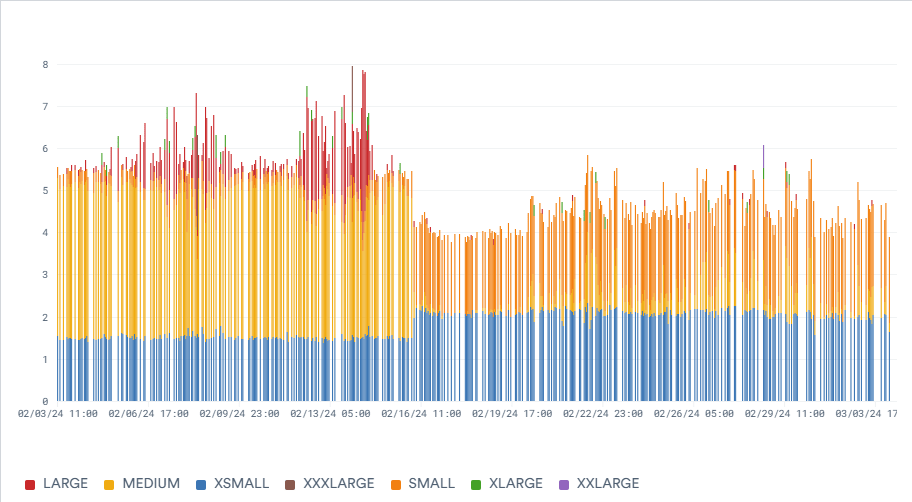
As result, max insert latency dropped below 30s and overall staleness of Kubernetes container logs improved significantly. The number of queries that the loader executes of course increased (in fact it runs 4x more queries), but they run on smaller warehouses which are better utilized, and so the overall effect on cost is net-positive as shown on this graph of credit costs by warehouse size:

Resulting Costs Savings
After this focused optimization effort, we saw a significant reduction in the costs of running our O2 tenant, including nearly 50% reduction in Snowflake costs, improving our bottom line.
Our AWS costs associated with running the scheduler, transformer and API components were also noticeably reduced.
Some of the efforts in O2 were directly applicable to any customer of Observe. Our customer-facing data engineers incorporated many of those improvements into customer configurations, improving the bottom line of our customers.
Conclusion
Managed solutions live and die by their quality and uptime. Quality and uptime are directly related to what you can measure and how you manage it. To measure something you have to observe it.
Observe provides a highly available, immensely configurable, easy to use observability solution to our customers. The self-usage of the product offers great visibility into technical and product usage details to product engineering and product management. At the same time, it contains a wealth of useful data on customer usage for our field engineering and sales teams.
A good housecleaning is always a good thing. When it is coupled with focus on efficiency, the rewards can be truly impressive. Our recent work optimizing O2 for performance and efficiency resulted in tremendous improvements in performance of the platform and much-reduced costs across the board.
Come see for yourself with our free trial!

