Easier Observability: How Observe Overcomes Cardinality, Retention, and Tool Proliferation Challenges
At Observe we often hear from customers about their current observability tools and the workarounds that they’ve learned to put up with. We believe that your Observability stack should reduce toil for teams, not become a concern in and of itself. This post addresses several workarounds that one organization was able to eliminate by switching to Observe.
Pain: Costly High Cardinality Metrics
Coming from Datadog, this organization was very concerned about metric cardinality. To be fair, that’s a problem in lots of observability tools! Adding more dimensions makes the query processing and storage costs balloon out of control in many of the observability products on the market today, because they’re not really architected for the needs of cloudy microservices. Combined with often confusing pricing models for standard or custom metrics, it’s a recipe for pain. For example, this organization had limited themselves to 4 dimensions, making troubleshooting much harder. Their engineers told us that they would love to have accountID as a dimension in their Datadog metrics, but could not add this because it would drive their costs past their budget. In many organizations, the number of unique accountIDs used over any meaningful time range is huge, tens of thousands of items or more. Adding that dimension in a legacy platform multiplies each existing dimension by those unique values, causing cardinality to explode and performance to crater.
As is often the case, to get around this limitation in their primary platform, they added a distributed tracing tool (Honeycomb), which has more dimensions and supports higher cardinality. However, their Honeycomb data was sampled, so making the jump from one tool to another in a troubleshooting session wouldn’t always work. Rolling the dice to see if you’ll get an answer makes troubleshooting feel more like a terrible game than a professional task.
Solution: Observe’s Unlimited Cardinality
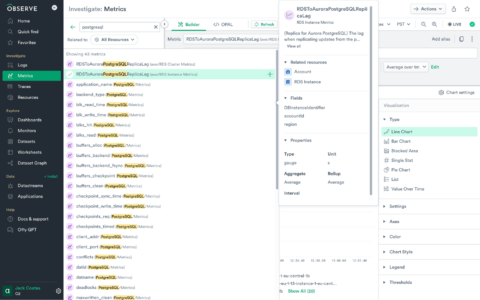
Observe isn’t hobbled by the same architectural limitations this organization was working around with Datadog and Honeycomb, and by solving a deep technical problem, we empowered the organization to focus on their business problem. Because we don’t need to pre-build indexes for each discrete time series, we can provide a much more economic answer to the high cardinality problem. We helped the engineering team redirect their metrics to Observe, and added the dimensions they wanted to work with. From there, it was as simple as browsing those dimensions in the Observe Metric Explorer and showing them how we manage cardinality.

From here, they were able to build dashboards and monitors entirely within the user interface, then export those configurations to Terraform for source control. By allowing them to focus on the outcomes they wanted versus fighting against technical and commercial limitations, Observe helped them consolidate from two separate tools.
Pain: CockroachDB Performance
This team’s DevOps engineers need to perform many microservice analysis tasks; a particularly difficult one for them was to find poorly performing SQL queries from their CockroachDB database service. Currently, they have to find a long running SQL span in Honeycomb, copy the SQL query from the span, and paste it into the CockroachDB admin dashboard to find the correct configuration object. This technically works, but they have a hard time finding SQL statements that need optimization this way. Duration of span is only one indicator of an optimization opportunity, juggling multiple tools is always a problem, and at best the process takes more time than necessary.
Solution: Observe’s Schema-on-Demand Extraction of SQL Statements
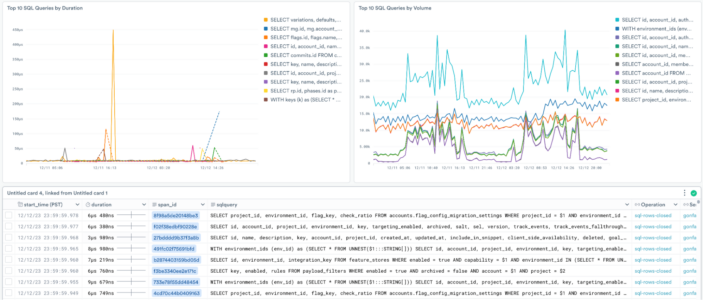
Using Observe we were able to quickly extract SQL statements from CockroachDB spans and create a dashboard showing:
- Top SQL Queries by Duration
- Top SQL Queries by Volume
- Full SQL Statements in Context

This task was initially performed using our front end to extract the queries, then optimized in the OPAL Editor pane with some assistance from our O11y Co-pilot AI before exporting to Terraform for source code control.
Pain: Log Retention in Datadog
Like so many organizations, this organization is only able to use their logs for alerts and recent troubleshooting; their Datadog system is limited to 30 days of retention (which is a common problem for data services designed for aggregated storage and compute). Modern organizations rely on their long term logs to understand changes in service health and track security incidents, and it hurts their success to be confined to recent data and summarizations only.
Solution: Long-term Log Retention
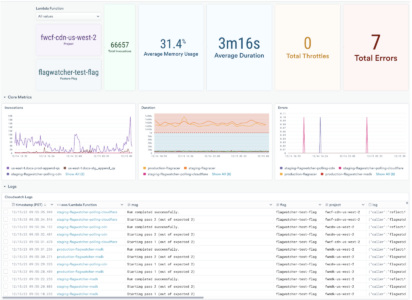
Using our Explorer interfaces, we were able to quickly do a deep analysis of their AWS Lambda logs and metrics, extract patterns that were relevant to their analysis, and set up monitors for alerting. We also created a health dashboard for their service owners.

Conclusion
In summary, Observe has proven to be a game-changer for this organization, offering solutions that effectively address the common pains experienced with other observability platforms. By overcoming challenges related to metric cardinality, CockroachDB performance analysis, and log retention, Observe has enabled this organization to streamline their observability operations significantly.
With Observe’s unlimited cardinality and schema-on-demand capabilities, the organization was not only able to add desired dimensions to their metrics without ballooning costs but also to extract and analyze SQL statements efficiently from their database service. This comprehensive visibility into their systems made troubleshooting and optimization tasks much less cumbersome and more accurate.
Furthermore, Observe’s long-term log retention provided the organization with the much-needed capability to delve into historical data. This ability is crucial for understanding service health trends and tracking security incidents over extended periods, something that was previously a limitation with their existing setup.
Overall, the transition to Observe has empowered this organization with a more robust, cost-effective, and efficient observability strategy. They have successfully consolidated their toolset, reducing complexity and improving their operational agility. In essence, Observe has not only addressed their immediate technical challenges but has also aligned with their broader business goals, demonstrating that the right observability solution can indeed be a catalyst for organizational success. Come take it for a spin yourself.

