Observability, For The Rest Of Us
Traditionally, arcane tagging schemes are required to piece fragmented data back together — and we simply didn’t want to put our users through that pain.
A Cunning Plan For World Domination
Back in 2018, when the doors just opened at Observe, we were enamored with an emerging standard that seemed to be gaining traction: OpenTracing. Modern applications were becoming increasingly stateless — comprising tens to thousands of microservices. Troubleshooting had become increasingly nightmare-ish. However, developers could now just instrument all their code with OpenTracing et voilà, each developer can see every interaction within their app.
Even better, we believed we could interoperate with legacy Zipkin and Jaeger tracing libraries so users didn’t have to bet on a new standard like OpenTracing. The incumbent players were mired by legacy formats, agents, and architectures — we would then be poised to dominate the world!
But then we talked to a prospective customer, and another…and another.
In total, we spoke to over sixty customers in a period of three months during the fall of 2018. We found one — one measly — customer, who had implemented a distributed tracing library. Truth be told, our interviewee confirmed later that they had “implemented” (i.e. created the library), but they were still working to get the buy-in from engineering. Argh!
Therein lies the problem with distributed tracing libraries. The folks who historically felt the pain are the teams who support the application. They want more insight and traceability, but to get that they must convince the engineering team to spend a non-trivial amount of development time upfront. Most often this work never makes the cut because new features are almost always a higher priority — especially in the fast-growing, newer, companies.
Hey Developers, Fix Your Own Sh*t!
Engineers should care more about easily tracking down problems in their code. Teams should move more towards a true DevOps model where developers not only write code but also troubleshoot issues with that code in production. That is the way God intended this work, right?
The reality is that’s not what happens in most companies.
That’s not the only problem. Modern applications often rely on services delivered by 3rd parties. Nobody, except the vendor who delivers the service, has access to the source code. That means your instrumentation is at their mercy. It’s highly unlikely they’re going to adopt your distributed tracing library.
Shortly after its wide adoption, OpenTracing morphed and OpenCensus showed up on the scene — oy! As we speak, the “wrapper” for these critical tracing statements is still somewhat of a moving target with everything now being rolled into the OpenTelemetry project.
So, where do we go from here? Or, more to the point, where did Observe go from here?
Kicking the [Tracing] Can Down The Road.
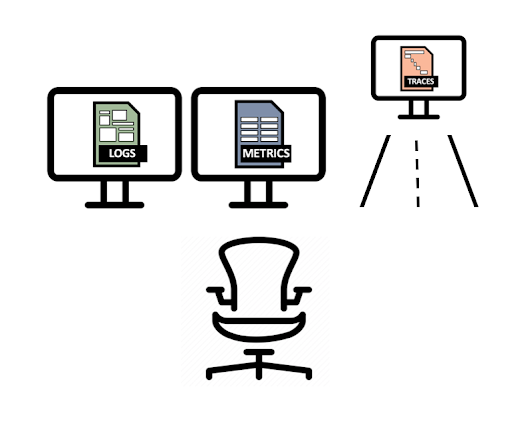 While we remain convinced tracing will have its day, it’s clear that day is not coming anytime soon. However, we did notice during those sixty customer interviews that people were generally unhappy with their current tooling — both technically and financially. Most of their angst centered around logging and metrics, and incredible frustration with not being able to seamlessly move between the two. Or, more specifically, the ability to retain context as they move between them.
Our first priority was to solve the logging and metrics problem. We could then fold in distributed tracing at a later date when it made sense. This approach enabled us to say to customers “send us what your application generates today and see the immediate benefit” versus “you’re doing it all wrong” or “throw away your logging and implement our tracing library”. When we say “see the immediate benefit” it doesn’t just mean saving a few bucks by eliminating tools, but rather enabling users to jump between their logs and metrics — and in the future, distributed traces. All while retaining context.
Everything Is An Event
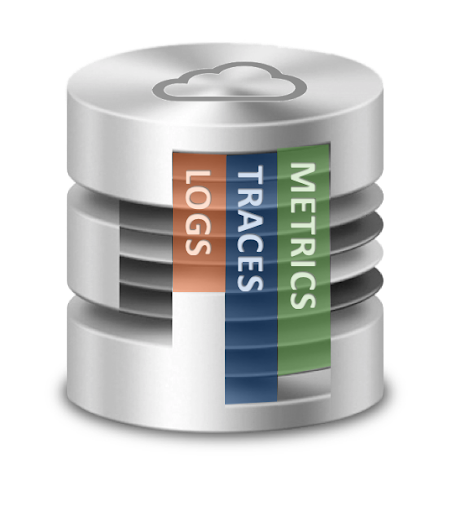
A key architectural pillar in our approach is that Observe handles all telemetry data as events. From day one, we knew we wanted to stream log events, time-series metrics, and trace events into a central database. We were maniacal about having all the data together, even if we were not yet able to elegantly visualize it.
 Traditionally, arcane tagging schemes are required to piece fragmented data back together — and we simply didn’t want to put our users through that pain.
Observe curates data the moment it is ingested. Put another way, we turn it from machine-generated gobbledygook into something humans can understand — things we call Resources. Some of this works out-of-the-box because we know the format of the data sources in advance (e.g. Kubernetes, AWS, etc.). Yet, some of this requires work on the behalf of our customers. Why? Take this scenario: a new patient care startup builds an application whose emitted logs use a proprietary format. We can’t possibly know the structure of every log source in advance, and it’s preposterous to think that you can predict them!
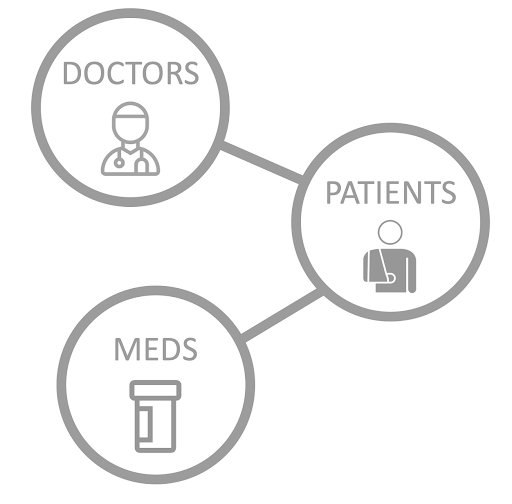
However, we can parse those logs on the fly — and with the customers’ help — extract key fields like Patient_Id, Doctor_id, Medication_Id, etc. We can then build a graph of how patients are related to doctors, medications, and much more.
There’s No Free Lunch With Observability
Wait a minute, did I just say the customer has to do some work? You might be thinking “how is that any different from asking them to implement a few OpenTelemetry statements?” While you’d be correct to assume that if you want a more observable system there is no free lunch, the amount of work differs dramatically with Observe. We take the data that your application(s) generate today and make it more understandable. Then, as the user begins to troubleshoot, they become more aware of the blind spots in their data. This affords for very prescriptive enhancements to logs — and metrics — to get the visibility the user desires.
To implement a distributed tracing library, you need to spend countless hours up-front rewriting your application code to emit structured events. Because if your events are not structured in a specific way, you can’t troubleshoot your application.
With Observe you can structure event data dynamically after the application emits it. You can also enhance this data incrementally, as needed. If your application only emits logs today, you’re good. Or, if the application moves to OpenTelemetry later, you’re still good!
To Trace Or Not To Trace? That Is The Question
 It’s important not to turn the topic of tracing into a matter of religion, i.e. “Does Observe believe in tracing?” In an ideal world, all software would be instrumented in a uniform and structured manner — making troubleshooting a breeze. But the world is not ideal, nor will it ever be.
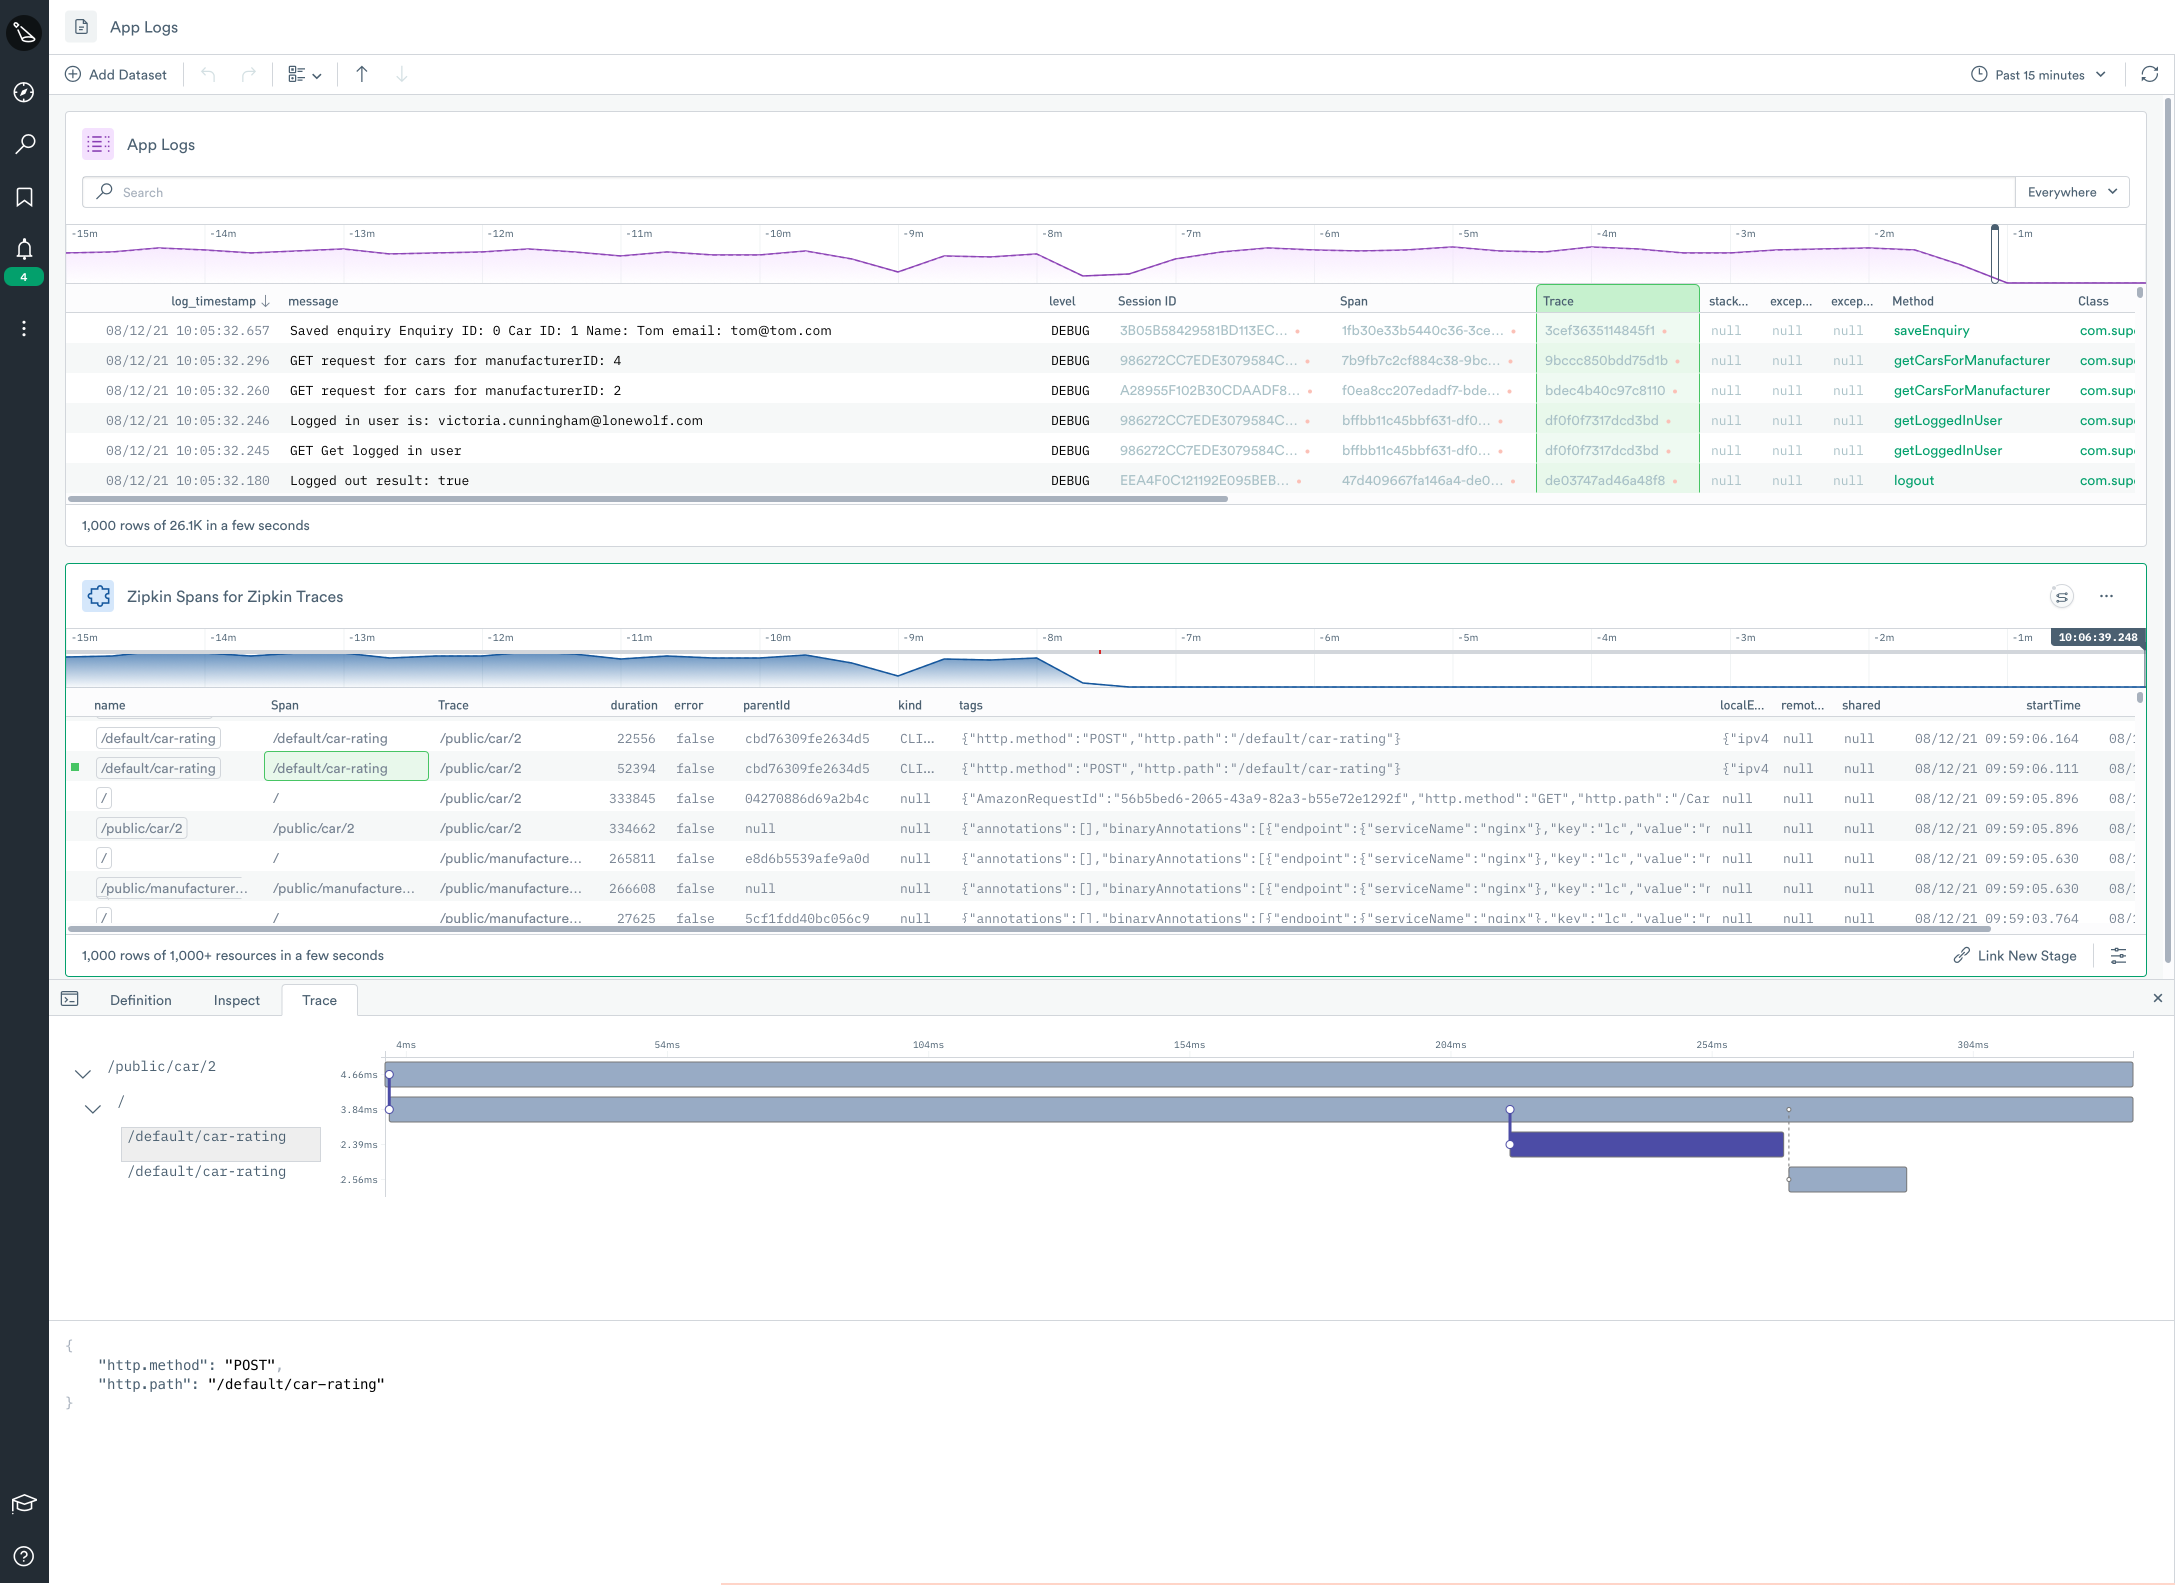
At Observe, we believe that distributed tracing is a must for any Observability offering. In fact, we already have it up and running in our own development environments. As we sit today, adoption rates for tracing are a fraction of those who have instrumented their applications with logs and metrics. This is where the majority of sweat equity has been invested thus far, and where most engineering teams will begin their observability journey.
And for that journey, Observe has you covered.
