

Monitoring Kubernetes Audit Logs

Kubernetes has emerged as the de facto platform for container orchestration, allowing developers to deploy, manage, and scale containerized applications easily. As organizations increasingly adopt Kubernetes for their cloud-native applications, ensuring the security and performance of these environments becomes essential.
One crucial tool in achieving this is Kubernetes audit logs. In this blog post, we will explore what Kubernetes audit logs are, why they are useful, how to obtain them, and provide practical examples of how they can help address performance and security issues.
What Are Kubernetes Audit Logs?
Kubernetes is a distributed system composed of many components, as shown in the diagram below. Each component communicates with each other and achieves its tasks via Kubernetes API Server. Kubernetes audit logs are records of the requests made to the Kubernetes API server. These logs capture detailed information about each request, including who made the request, when it was made, the type of request, the resource it was targeting, and the outcome. Essentially, audit logs provide a trail of activity within your Kubernetes cluster, offering insights into its operation and helping to detect and diagnose issues.

Why Are Kubernetes Audit Logs Useful?
Kubernetes audit logs are incredibly valuable for several reasons:
- Security Monitoring and Incident Response:
- Detecting Unauthorized Access: Audit logs can help identify unauthorized access attempts, providing information about who tried to access what resource and when.
- Tracing Malicious Activities: In the event of a security breach, audit logs allow you to trace the actions of the attacker, understand their behavior, and determine the extent of the compromise.
- Compliance and Auditing: Many regulatory standards require organizations to maintain detailed logs of system activity. Kubernetes audit logs can help meet these compliance requirements.
- Performance Monitoring and Troubleshooting:
- Identifying Bottlenecks: Analyzing audit logs can help you identify performance bottlenecks in your cluster. For example, you can detect if certain API calls are taking longer than expected or if there are frequent retries indicating issues.
- Resource Usage Patterns: Audit logs provide insights into how resources are being used over time, helping you optimize your cluster’s performance.
- Troubleshooting Failures: When something goes wrong, audit logs can help pinpoint the exact sequence of events leading up to the failure, making it easier to diagnose and resolve issues.
- Operational Insights:
- Understanding Workloads: Audit logs help you understand the behavior of workloads running in your cluster, allowing you to make informed decisions about scaling, resource allocation, and capacity planning.
- Tracking Configuration Changes: Audit logs can track changes to cluster configurations, helping you understand their impact and revert them if necessary.
How to Get Kubernetes Audit Logs?
Obtaining Kubernetes audit logs involves configuring your Kubernetes cluster to generate and collect these logs. It will differ based on the flavor of Kubernetes you have implemented– cloud-managed such as Amazon EKS or self-managed and whether you are running the API server in a container or as a Linux service. Here’s a step-by-step guide on how to do this:
- Enable Audit Logging:
- To enable audit logging, you need to configure the Kubernetes API server. This involves specifying an audit policy file and an audit log file.
- Create an audit policy file (e.g., audit-policy.yaml) that defines which events should be logged. Here’s an example of a simple audit policy:
apiVersion: audit.k8s.io/v1
kind: Policy
rules:
- level: Metadata
- Specify the audit policy file and log file location in the API server configuration, e.g., in the kube-apiserver systemd service, as shown below for self-managed Kubernetes clusters, or enable audit logs via the AWS console/CLI for EKS clusters:

- Collect and Analyze Audit Logs:
- No matter your Kubernetes distribution, you can use Observe to collect, analyze, and gain insights from Kubernetes Audit logs.
For self-managed clusters, follow the host monitoring quick-start to deploy the Observe agent. For managed implementations such as Amazon EKS, turn on audit logging and use Observe AWS integration to collect audit logs from the appropriate CloudWatch Log Group.
Practical Examples of Solving Performance and Security Issues with Kubernetes Audit Logs
Before we dive into practical scenarios, let’s look at the anatomy of the audit event to highlight some of the interesting fields:
{
  "kind": "Event",
  "apiVersion": "audit.k8s.io/v1",
  "level": "RequestResponse",
  "auditID": "6d15884a-85c7-451f-a82f-8c6986d7ac49",
  "stage": "ResponseComplete",
  "requestURI": "/",
  "verb": "get",
  "user": {
    "username": "system:anonymous",
    "groups": [
      "system:unauthenticated"
    ]
  },
  "sourceIPs": [
    "36.99.136.137"
  ],
  "userAgent": "Mozilla/5.0 (Macintosh; Intel Mac OS X 10_15_7) AppleWebKit/537.36 (KHTML, like Gecko) Chrome/96.0.4664.110 Safari/537.36",
  "responseStatus": {
    "metadata": {},
    "status": "Failure",
    "reason": "Forbidden",
    "code": 403
  },
  "responseObject": {
    "kind": "Status",
    "apiVersion": "v1",
    "metadata": {},
    "status": "Failure",
    "message": "forbidden: User \"system:anonymous\" cannot get path \"/\"",
    "reason": "Forbidden",
    "details": {},
    "code": 403
  },
  "requestReceivedTimestamp": "2024-06-16T04:54:05.978306Z",
  "stageTimestamp": "2024-06-16T04:54:05.980469Z",
  "annotations": {
    "authorization.k8s.io/decision": "forbid",
    "authorization.k8s.io/reason": ""
  }
}
You can set logging levels appropriately depending on the debugging or threat-hunting scenario and whether you want to log the request and response payload.
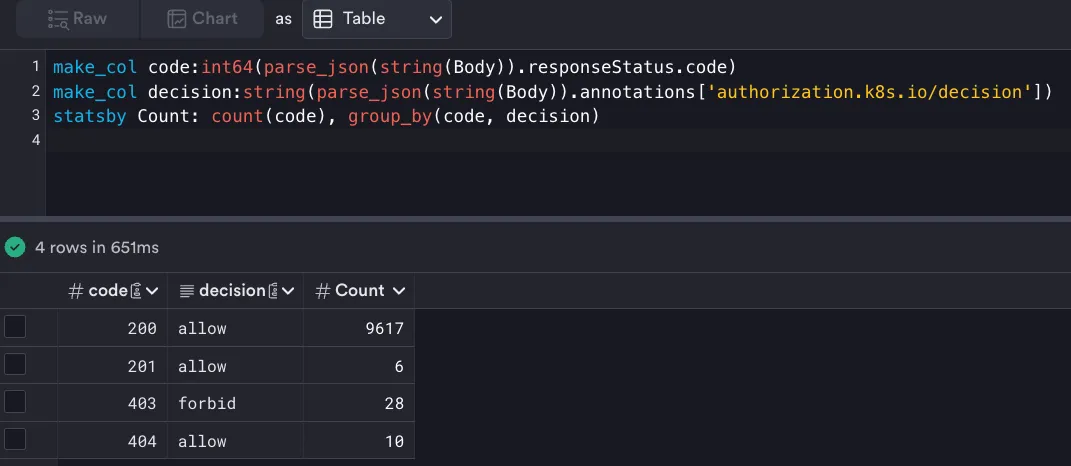
Scenario 1: Detecting Unauthorized Access
responseStatus.code can provide an indication of anomalous behavior. For example, if the number of 403s (forbidden) increases suddenly, that should be cause for an investigation.
Scenario 2: Threat Hunting on Source IPs and User Attributes
A useful hunting technique is looking for unrecognized IP ranges that are trying to access your clusters. Although IPs are set by the client and cannot be entirely reliable, seeing unrecognized IPs can still be a good Indicator of Compromise. Similarly, you can easily parse audit logs and look for usernames and userAgents who are making the API calls. Combining these fields, you can create an alert if a service account is used by a client outside the IP ranges of your private Kubernetes cluster.

Scenario 3: Monitoring Configuration Changes

If you have a Kubernetes cluster where multiple teams are making configuration changes and suddenly a critical application starts failing, you can review the audit logs to trace back to the exact configuration changes made around the time the application started failing. This can help you identify if a recent change is the cause of the issue and allow you to revert the change or take corrective actions.
Scenario 4: Achieving Compliance Readiness
Many organizations need to comply with regulatory requirements that mandate detailed logging of system activities. Kubernetes audit logs provide a comprehensive record of all cluster activities, helping you demonstrate compliance with these requirements. You can use tools to review and archive these logs regularly, ensuring that you have the necessary records in case of an audit.
Challenges with Traditional Log Management Solutions
Many observability vendors cannot handle the high volume of fast-moving log data from cloud-native distributed systems such as Kubernetes. Solutions such as Datadog use an index-based approach and recommend indexing only a subset of the ingested data, creating visibility gaps.
Furthermore, retaining log data for extended periods in Datadog can become prohibitively expensive, so Datadog recommends extracting metrics from logs for historical analysis.
Why Does Datadog Make You Pay Twice to Analyze the Same Data?
Datadog utilizes separate backends for its log and metrics solutions. So, when it derives metrics from logs, a separate environment in the time series database must be provisioned to generate insights. This additional cost is then passed on to Datadog’s customers as custom metrics.

Even if you are running a moderately sized cluster comprising 200 nodes and want insights on userAgent, sourceIPs, nodes, and status codes, similar to the examples shown above, you could potentially be looking at 1.8 million custom metrics and an additional cost of $68,000 per month.
Modernize Log Analytics with Observe
Observe is a modern, cloud-native observability platform that delivers blazing-fast performance at a petabyte scale while massively reducing the total cost of ownership. It unifies metrics, events, logs, and trace data in a highly performant unified data lake and automatically builds correlated relationships between entities in the entire stack. This allows you to ask exploratory questions, detect anomalies, find their root causes, and resolve them efficiently.
Observe offers industry-leading default retention of all data, including log data, for thirteen months. This extended retention period helps you achieve compliance readiness, investigate exploit attempts retroactively, or compare performance baselines over time. As the examples above demonstrate, Observe enables you to easily extract interesting fields from your log data using a point-and-click UI to build interactive dashboards and contextual alerts. With Observe, you can slice and dice log data as desired without incurring additional costs.
Ready to Observe
Ready to gain security and performance insights from your Kubernetes audit logs and high cardinality cloud-native infrastructure data without incurring cost overruns? Start your Observe journey with a free trial.
