What’s New: Trace Explorer
Tracing, what’s that and why does it matter?
Modern web & mobile services are highly complex distributed systems. This means that when you deposit a check in your mobile banking app or add an item to your cart on an e-commerce site, your request passes through many microservices running on all sorts of different architectures. As a developer working on such a system, this means that if you’re trying to debug a slow or failing request from a user, you need to stitch together data from all of those services and the infrastructure they run on in order to put together the picture of what happened to the request and answer your troubleshooting questions:
- Where did the request fail?
- Was the issue upstream or downstream of my service?
- Was the issue caused by application code or the infrastructure used to serve the request?
- In which version(s) of my service does the issue appear?
Enter distributed traces. They connect user requests flowing through complex distributed architectures to the resources (e.g., microservices, databases, caches, kubernetes pods, Kafka topics, etc.) that serve those requests, which organizations rely on to get visibility into the user experience and also debug that experience when things go wrong.
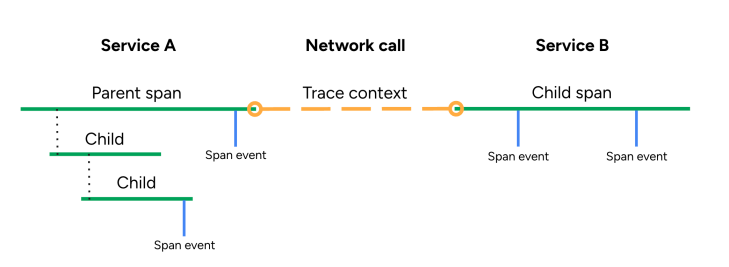
A distributed trace is made up of spans connected by a tracing context that ties the spans together into a single representation of a user request. If you come from a logs background, you can think of each span as a log that represents some bit of work done by some part of some service. That “log” contains metadata that describes what work it did, how long it took, and what resources were involved in the execution of that work.
Tracing instrumentation propagates the trace context across the request lifecycle, creating spans and adding attributes to them that makes them useful for debugging. In the past, that instrumentation only came from expensive proprietary solutions, but many organizations that we work with are switching to instrumentation provided by OpenTelemetry. Traces help you visualize inter-service communication, like this:

I’ve heard firsthand from customers that bringing in tracing data can cut down MTTR (Mean Time to Resolution) from hours or days to as little as 15 minutes, because of all the rich context that even a single distributed trace can provide!
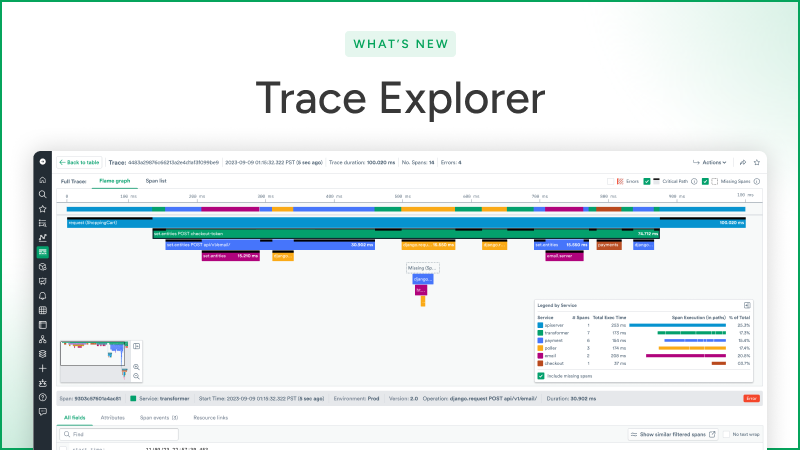
But just because your observability solution provides an endpoint to ingest tracing data, that doesn’t mean you’ll be able to realize that reduction in MTTR. You need to be able to visualize and search on that tracing data effectively in order to make use of it. Enter Observe’s Trace Explorer, completely rebuilt from the ground up, generally available today!
Search 100% of your traces for 13 months
Our users tell us that when debugging a slow or failing user request, they need to be able to inspect the associated trace in great detail to find out:
- What exactly is the call structure for this request?
- Where was the time spent?
- What services were involved in the execution of the request?
- What infrastructure were those services running on?
- If an error occurred, what was the stack trace?
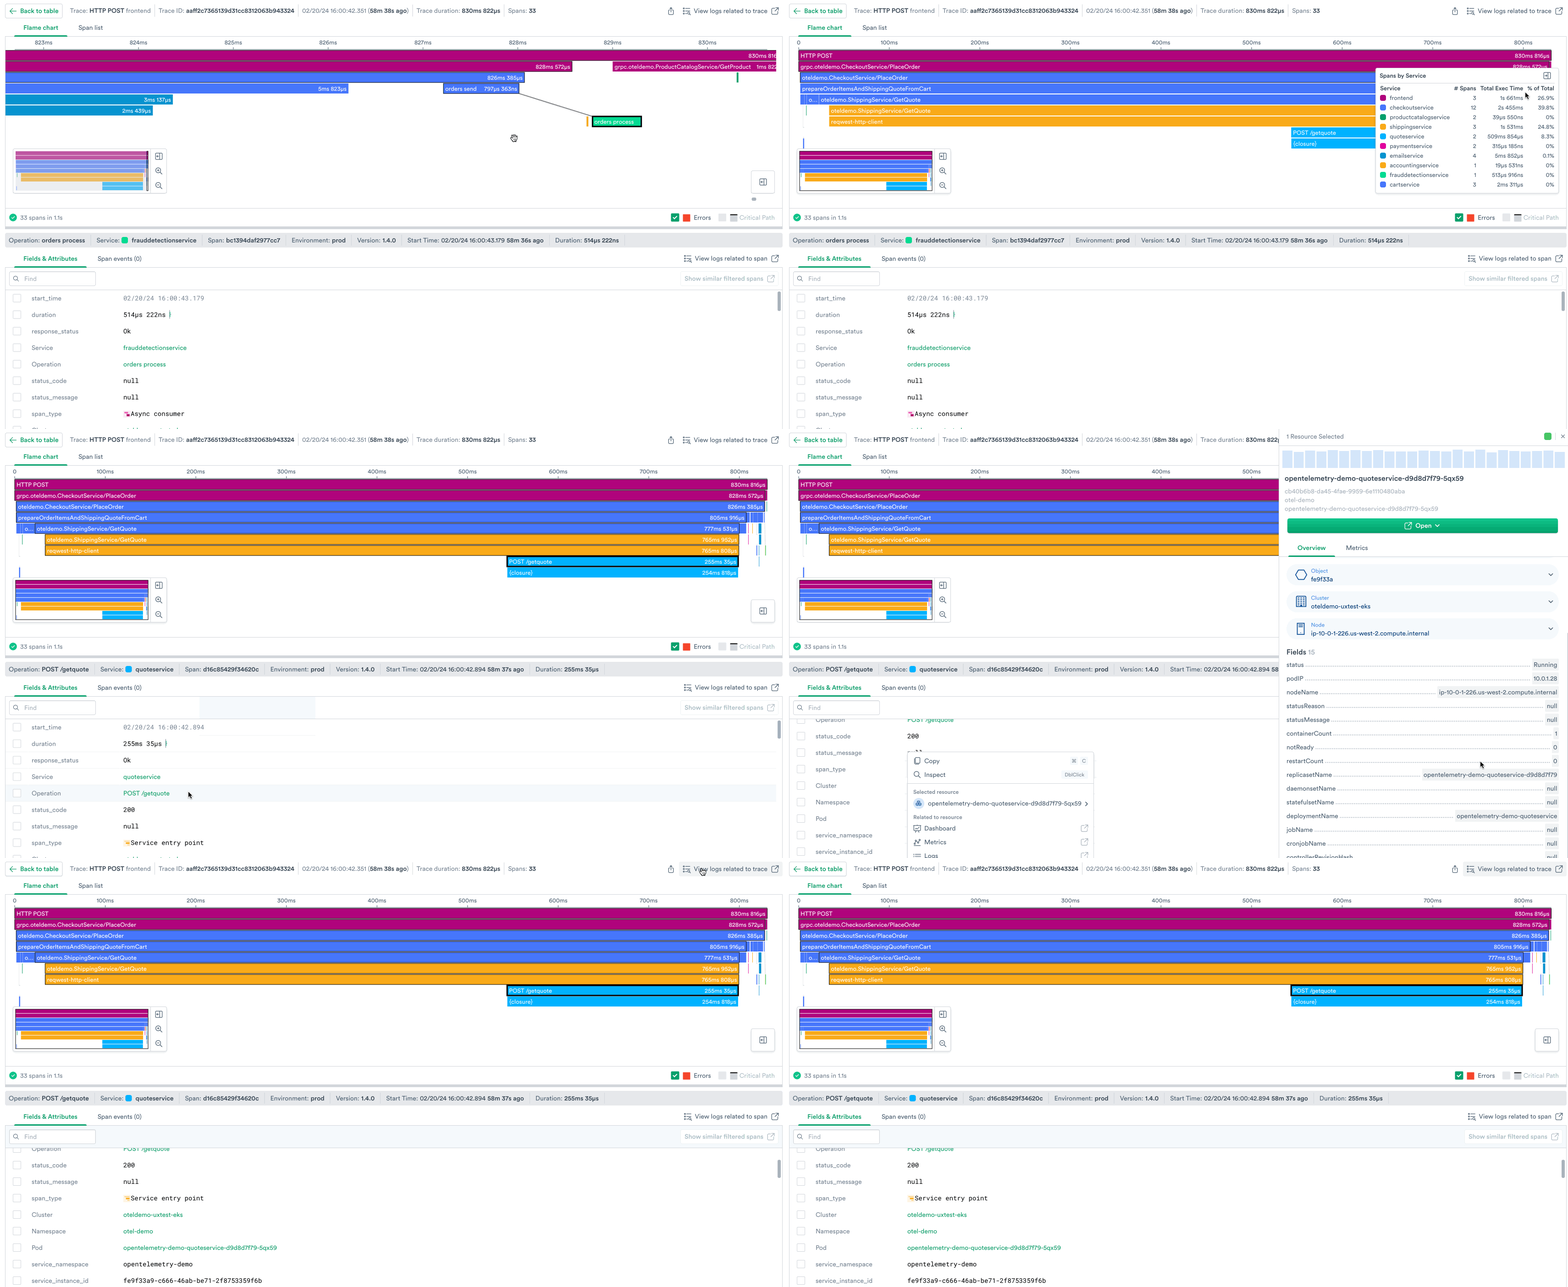
Observe’s trace viewer provides an interactive flame chart that illustrates the request flow through every span – every unit of work – in the trace, while clearly illustrating service boundaries with a color legend and surfacing attributes on each span that indicate what k8s pod it ran on, which SQL query it made, and much more metadata about each request.

Answering these questions helps you put together a narrative of exactly what happened with this request, for example:
- This request made several database calls that could have been made as a single more efficient call.
- Or, it made one very slow database call with SQL that could be optimized.
- Or, it hit an external API that took a long time to return.
- Or, the code ran two computations in sequence that could have been parallelized.
- Or, all of these things happened in a single slow request!
From here you can use the power of resource linking in Observe to:
- Inspect the health of a microservice that was involved in this request.
- Look at dashboards for the associated k8s infrastructure or databases identified in the span attributes.
- Search for logs associated with this trace to gain even more context about what happened.
In one screen in the product we’ve stitched together all the context that helps you debug this request.
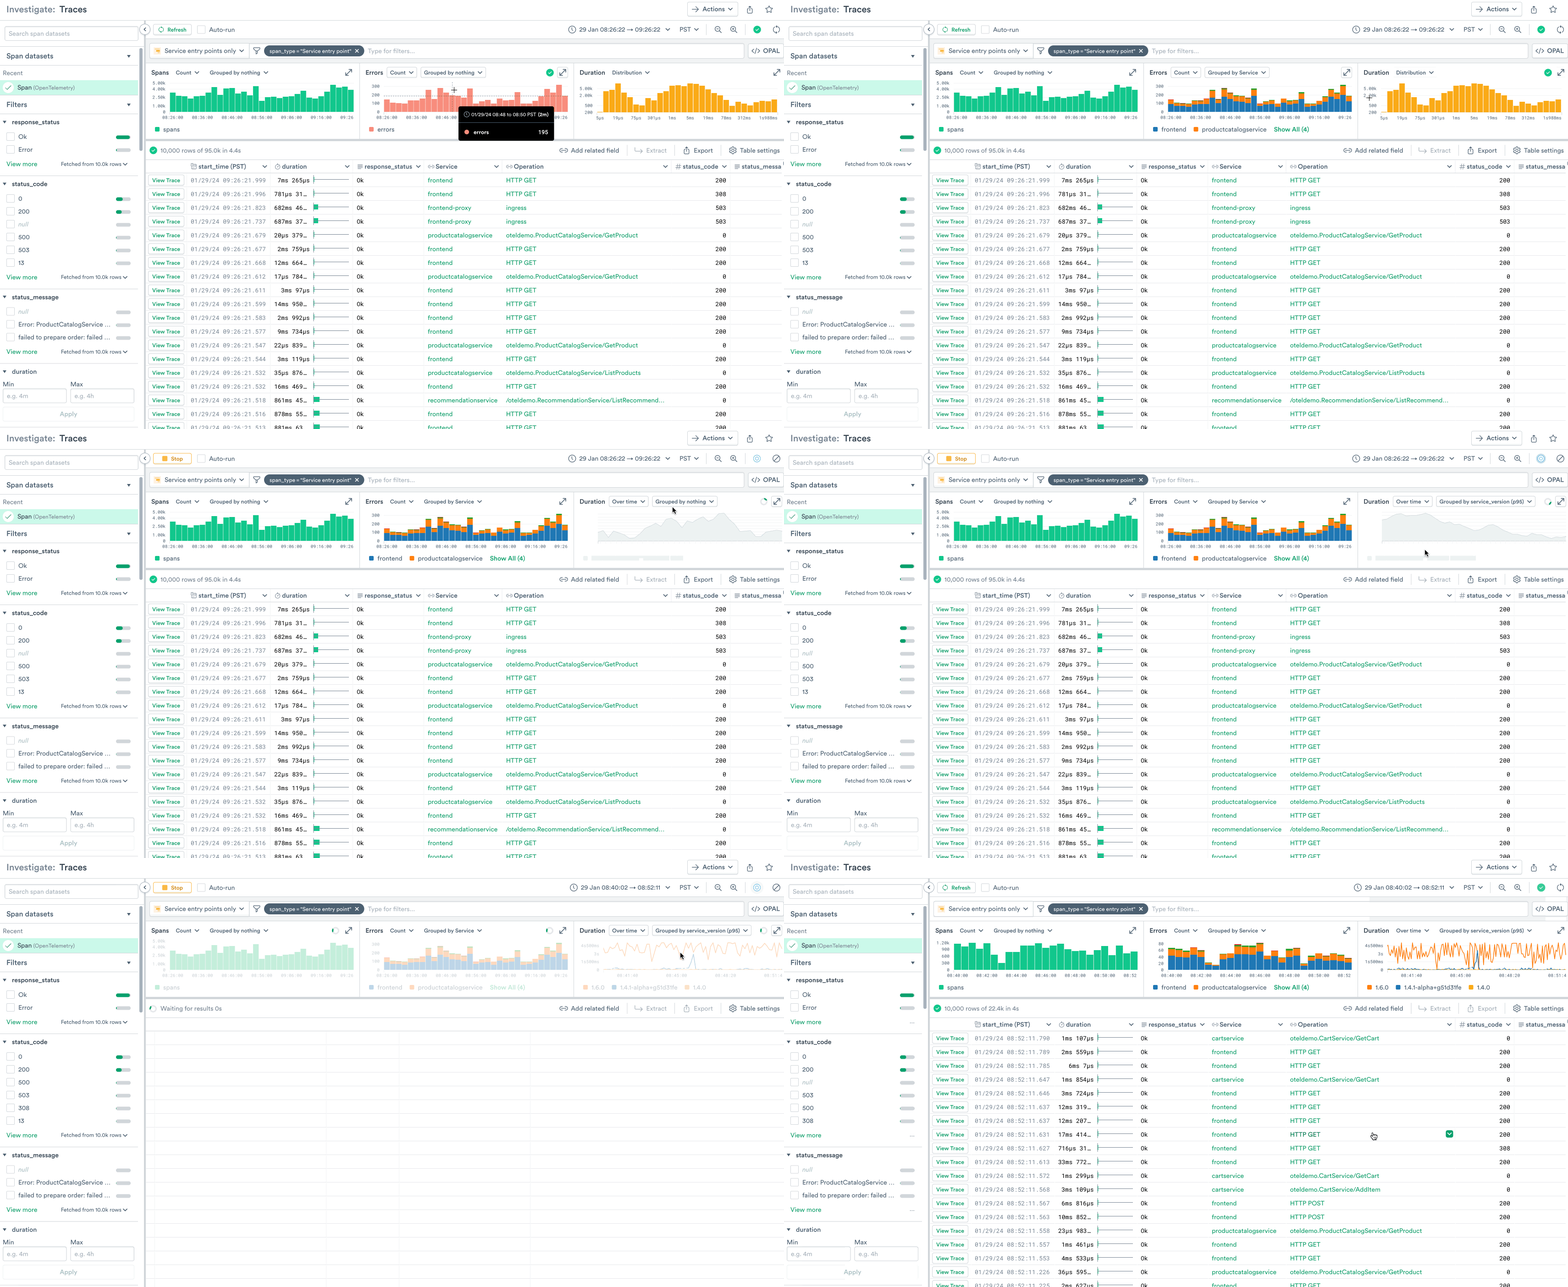
But analyzing trace data for troubleshooting is much more than inspecting individual traces. Often when you’re investigating an issue or figuring out where to optimize your service, you need to understand the performance of your traces in aggregate, and find many example traces that you can inspect further. That’s why we’ve built powerful trace searching and summarization capabilities into our Trace Explorer.

In this search we’ve grouped the duration chart by version. From this we can glean that our new version 1.6.0 has introduced a latency regression, and we can immediately take action to roll back the deployment.
We’ve also grouped the error chart by service, and we can see that the majority of errors are being generated by our frontend service, so we can filter this search to just the traces in the frontend service and continue our investigation from there.
When you’re inspecting a trace, let’s say you form a hypothesis that the slowness is coming from a particular kubernetes pod. You can easily test that hypothesis by selecting the pod name attribute in the span inspector and run a refined search for traces with spans that ran on just that pod.
At last, a modern architecture for tracing data
At a past job, I worked with a customer who wanted to distinguish between different user populations in their traffic – in their case, different versions of a gaming console – so they could monitor and alert on each population separately. A simple regex transform on the user agent attribute in their traces would have enabled this use case for them, but that product’s ingest pipeline couldn’t easily support these types of custom transforms. The only solution we could deliver for them in that product was to perform the regex at query time, which is slow and expensive. This problem is a thing of the past with Observe – not only can you re-transform your trace data on the fly with schema-on-demand, but you can also create new materialized views based on whatever transformations you want to make. In our customer’s case, that means they’d be able to add an attribute for console version to their data at ingest time, so that it’s already available to them at query time without needing to perform an additional costly transform.
I’ve also worked with customers who invested heavily in custom tracing instrumentation simply because they needed to split up their requests into multiple traces in order to work around the architectural limitations of other tracing products. These customers were frustrated with products that limit trace duration to as little as ~5 minutes. Observe does away with the concept of trace assembly entirely – that means we can handle traces of arbitrary duration, so our customers are able to monitor longer-lived transactions such as those flowing through data pipelines with ease.
Lastly, our customers tell us that the tracing products they are migrating from forced them to sample their data, sometimes as much as 10000 to 1, due to the tools’ inability to handle ingest volumes or exorbitant pricing structures (or both!). Sampling can be useful, but sampling this heavily on every request coming in negates much of the advantage of using tracing data to gain deep introspection into individual bad requests. How can you understand your user experience if you’re throwing away 99.99% of it indiscriminately? We recently scaled our ingest to handle one petabyte per day for a single tenant at costs that are economical to our customers with usage-based pricing, which means whatever your scale, you won’t need to sample. And unlike other products that only retain your trace data for a few days or weeks, Observe retains 100% of your tracing data in our Data Lake for 13 months. That means you can use our Trace Explorer to not only investigate active incidents, but analyze the performance of your service over the last month or year and proactively identify optimizations you can make to your code or architecture.
When you’re searching, analyzing, and visualizing billions of traces, you need an observability solution that’s built on a data lake, with schema-on-demand for effortless transformation, and petabyte scale. Come take it for a spin yourself with a free trial!

