Integrations: Linux Host Monitoring
Our latest Terraform module provides users with an easy and convenient way to stream metrics, logs, and system state from their Linux hosts back to Observe.
Though Observe was built to allow users to be able to easily collect data from their cloud-based services such as Kubernetes, this module allows for monitoring of more traditional infrastructure that is not managed by an orchestration tool or framework. This can be useful for providing basic host monitoring after a lift-and-shift migration, or to monitor other non-managed infrastructure such as bastion hosts, build servers, or more.
In addition to simply gathering logs, metrics and monitoring your Linux-based hosts, the real power from this integration comes from the ability to link this data to other — typically disjointed — sources of data for new insights.
Note: Users can install this integration by following the steps outlined here.
Architecture
Our Linux host monitoring integration uses three open-source utilities to gather metrics, logs, and system state from various endpoints and send them to Observe: OSQuery, Telegraf, and Fluent Bit.
- OSQuery is an open-source endpoint agent that collects user snapshots, uptime counters, and system properties from hosts.
- Telegraf is an open-source agent that we use to collect host metrics. Thanks to Telegraf’s plugin-driven architecture and abundance of plugins, it can also be used to collect a wide range of data and metrics such as performance data from the Apache HTTP Server, MySQL metrics, and much more.
- Fluent Bit is an open-source log processor and forwarder. This component is how logs and metrics from the other agents get sent to an Observe instance. Similar to Telegraf, Fluent Bit has a wide variety of plugins available for collecting various types of metrics and logs.
This particular architecture allows us to take advantage of various proven open source projects specifically designed to solve a single problem. Each of these collectors is lightweight, widely used, active, and performant.
Note: Observe supports any agent you may wish to use, however, our out–of-the-box content for this integration is designed for this specific collection of agents.
Included Datasets
This new integration contains dozens of new datasets — twenty-five at the moment — comprised of useful metrics, logs, metadata, and more to aid users with troubleshooting issues in their environment(s). All of these new datasets can be easily found in the “Explore” tab underneath “Datasets”.
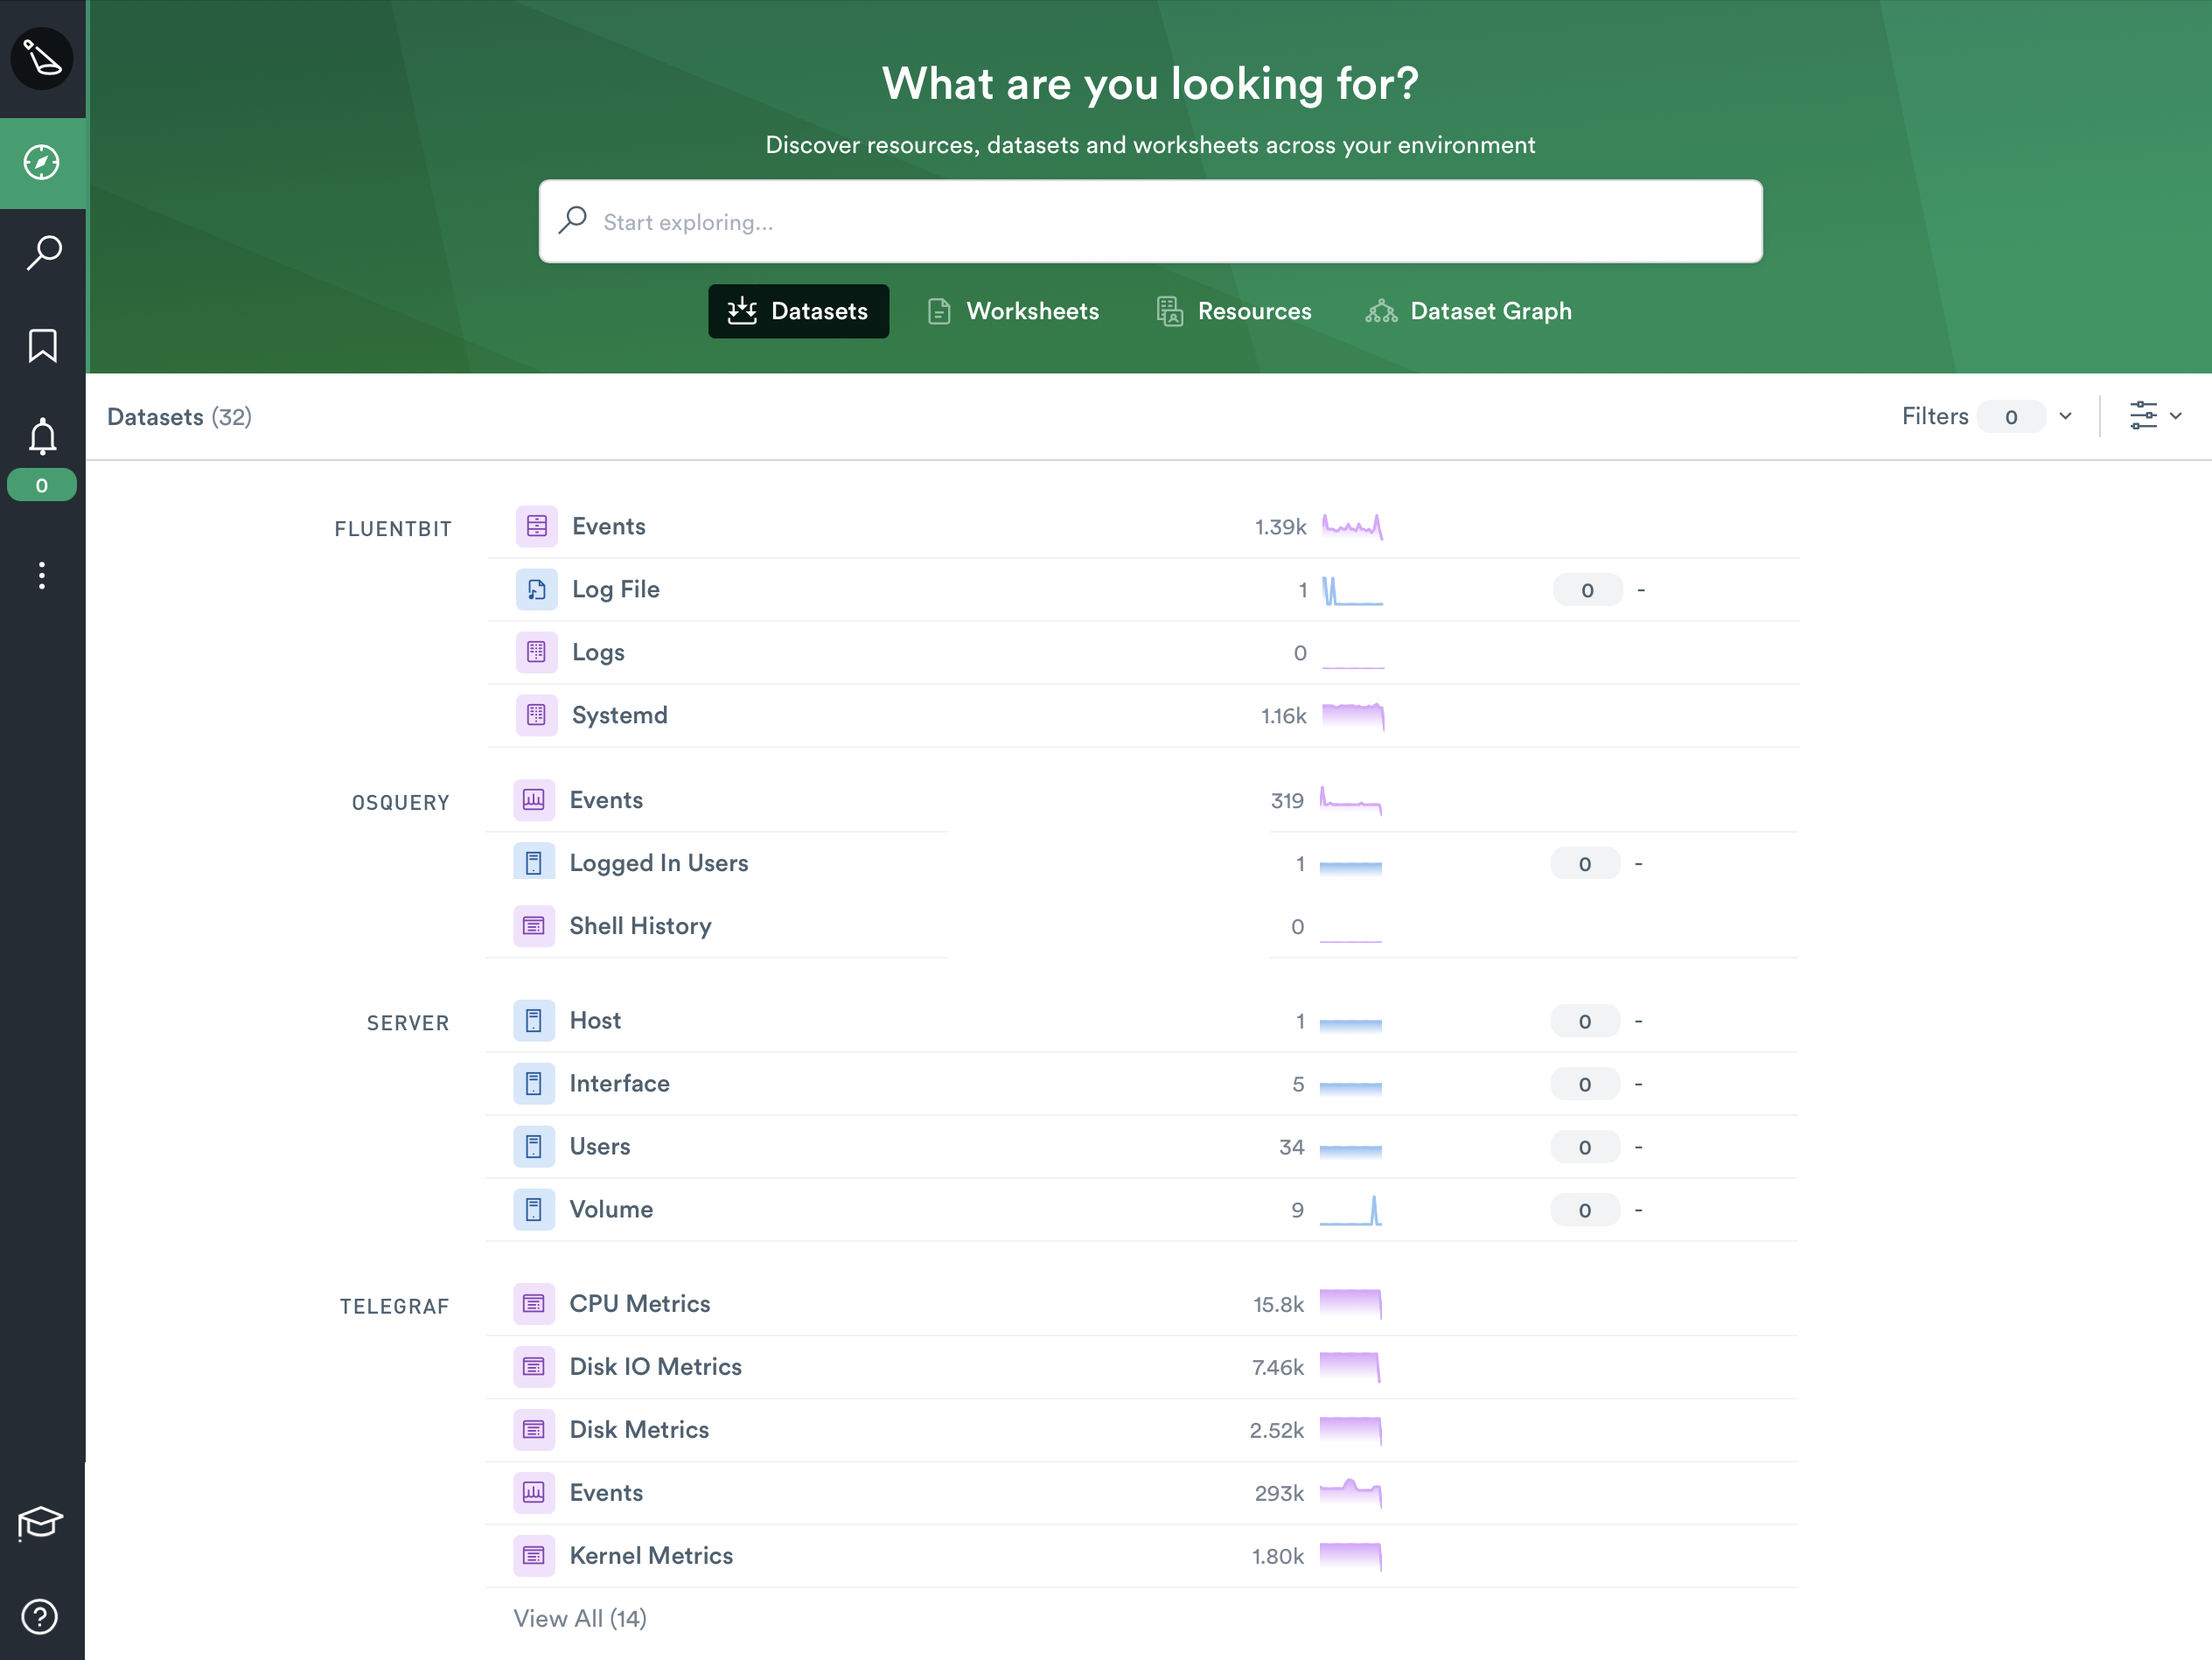
Though we wish we had time to explore each of them in-depth, we will look quickly at three of the more interesting datasets included in this integration.
Host
One of the first things you’ll notice about the Host dataset is that we’ve included a default dashboard that contains a few common metrics users expect to find when researching issues at the host level. Users can create as many dashboards as they wish, and populate them with over a hundred metrics to choose from. Common metrics like CPU, Memory, and Disk metrics, to less common metrics like Processes Metrics, and even Kernel Metrics can be found in the sidebar.
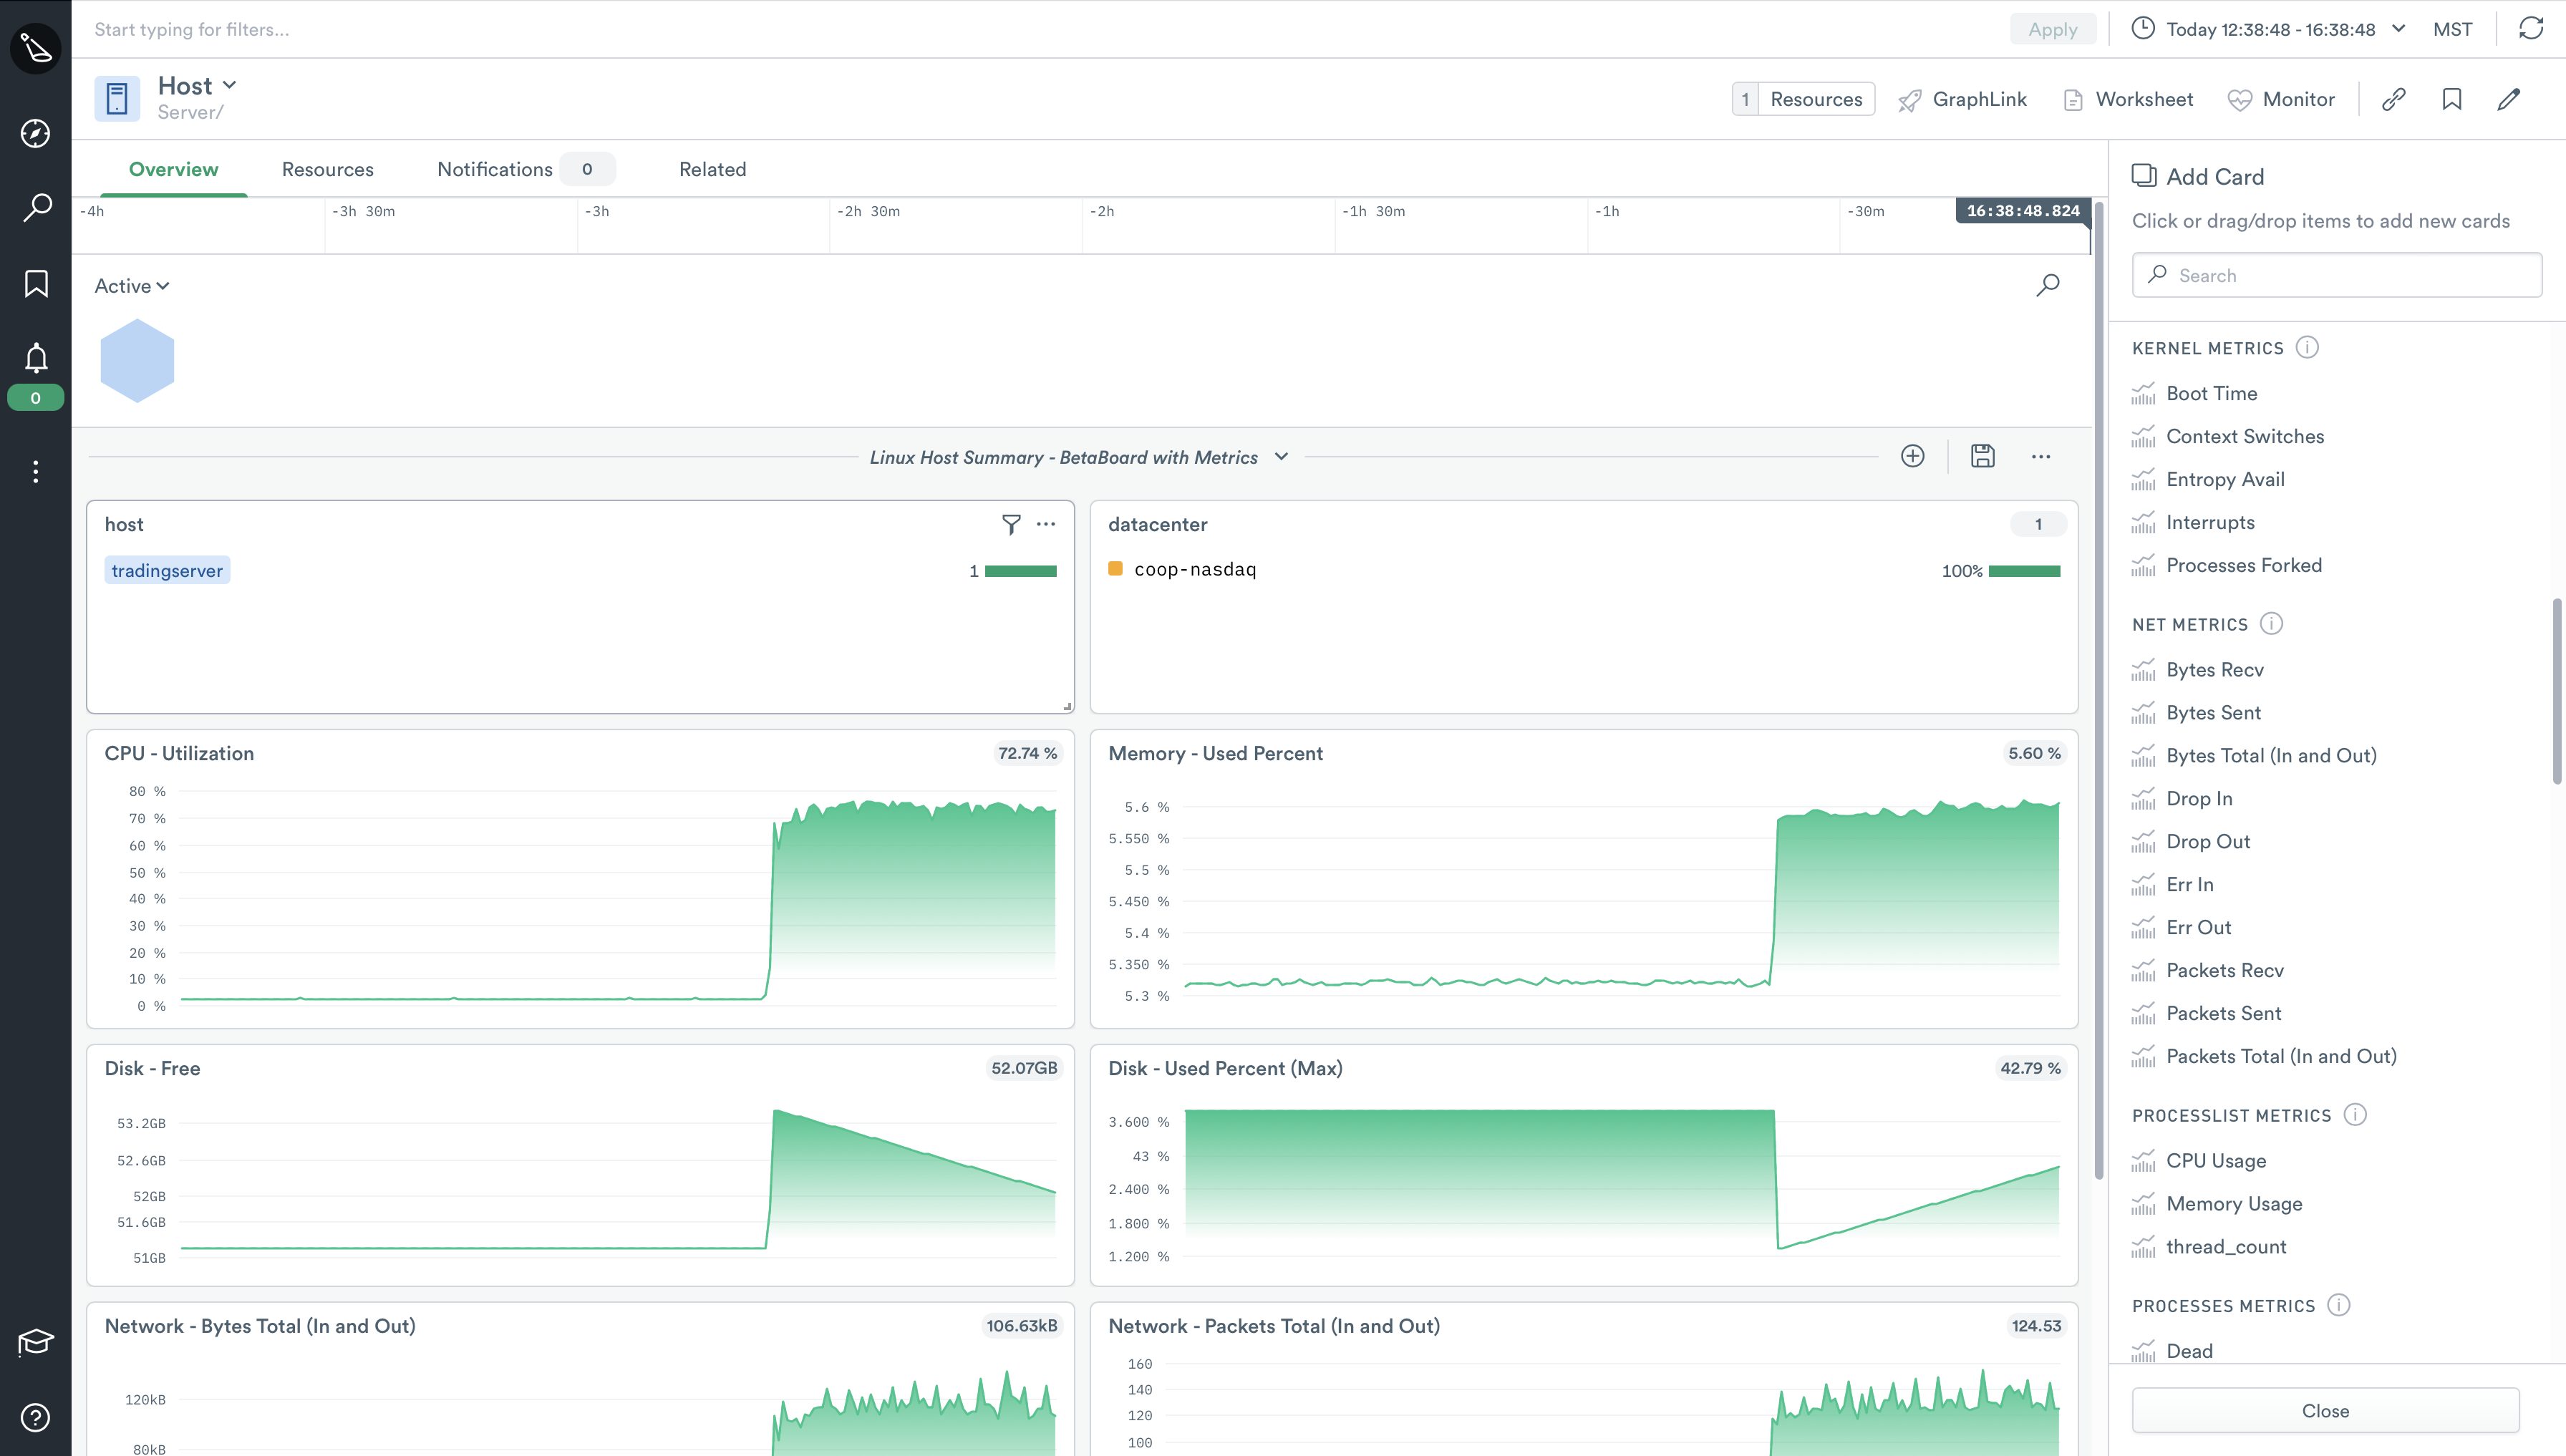
But as nice as dashboards are, we can take this data a step further and put it to work for us. Because the Host dataset is constructed from a multitude of other datasets (Devices, System Metrics, Logs, etc), it inherently has many relationships with other datasets which we can use to see connections in data we couldn’t see before.
This allows users to quickly investigate “things” related to hosts like users, disk metrics, and even create custom monitors to alert on a nearly endless possibility of scenarios. We can’t wait to see what our users can do with this new resource.
Volume
The new Volume dataset provides users with quick and granular access to a plethora of data and metrics related to volumes on your monitored instances to ease troubleshooting, enable advanced monitoring, or even for use in auditing and compliance checks.
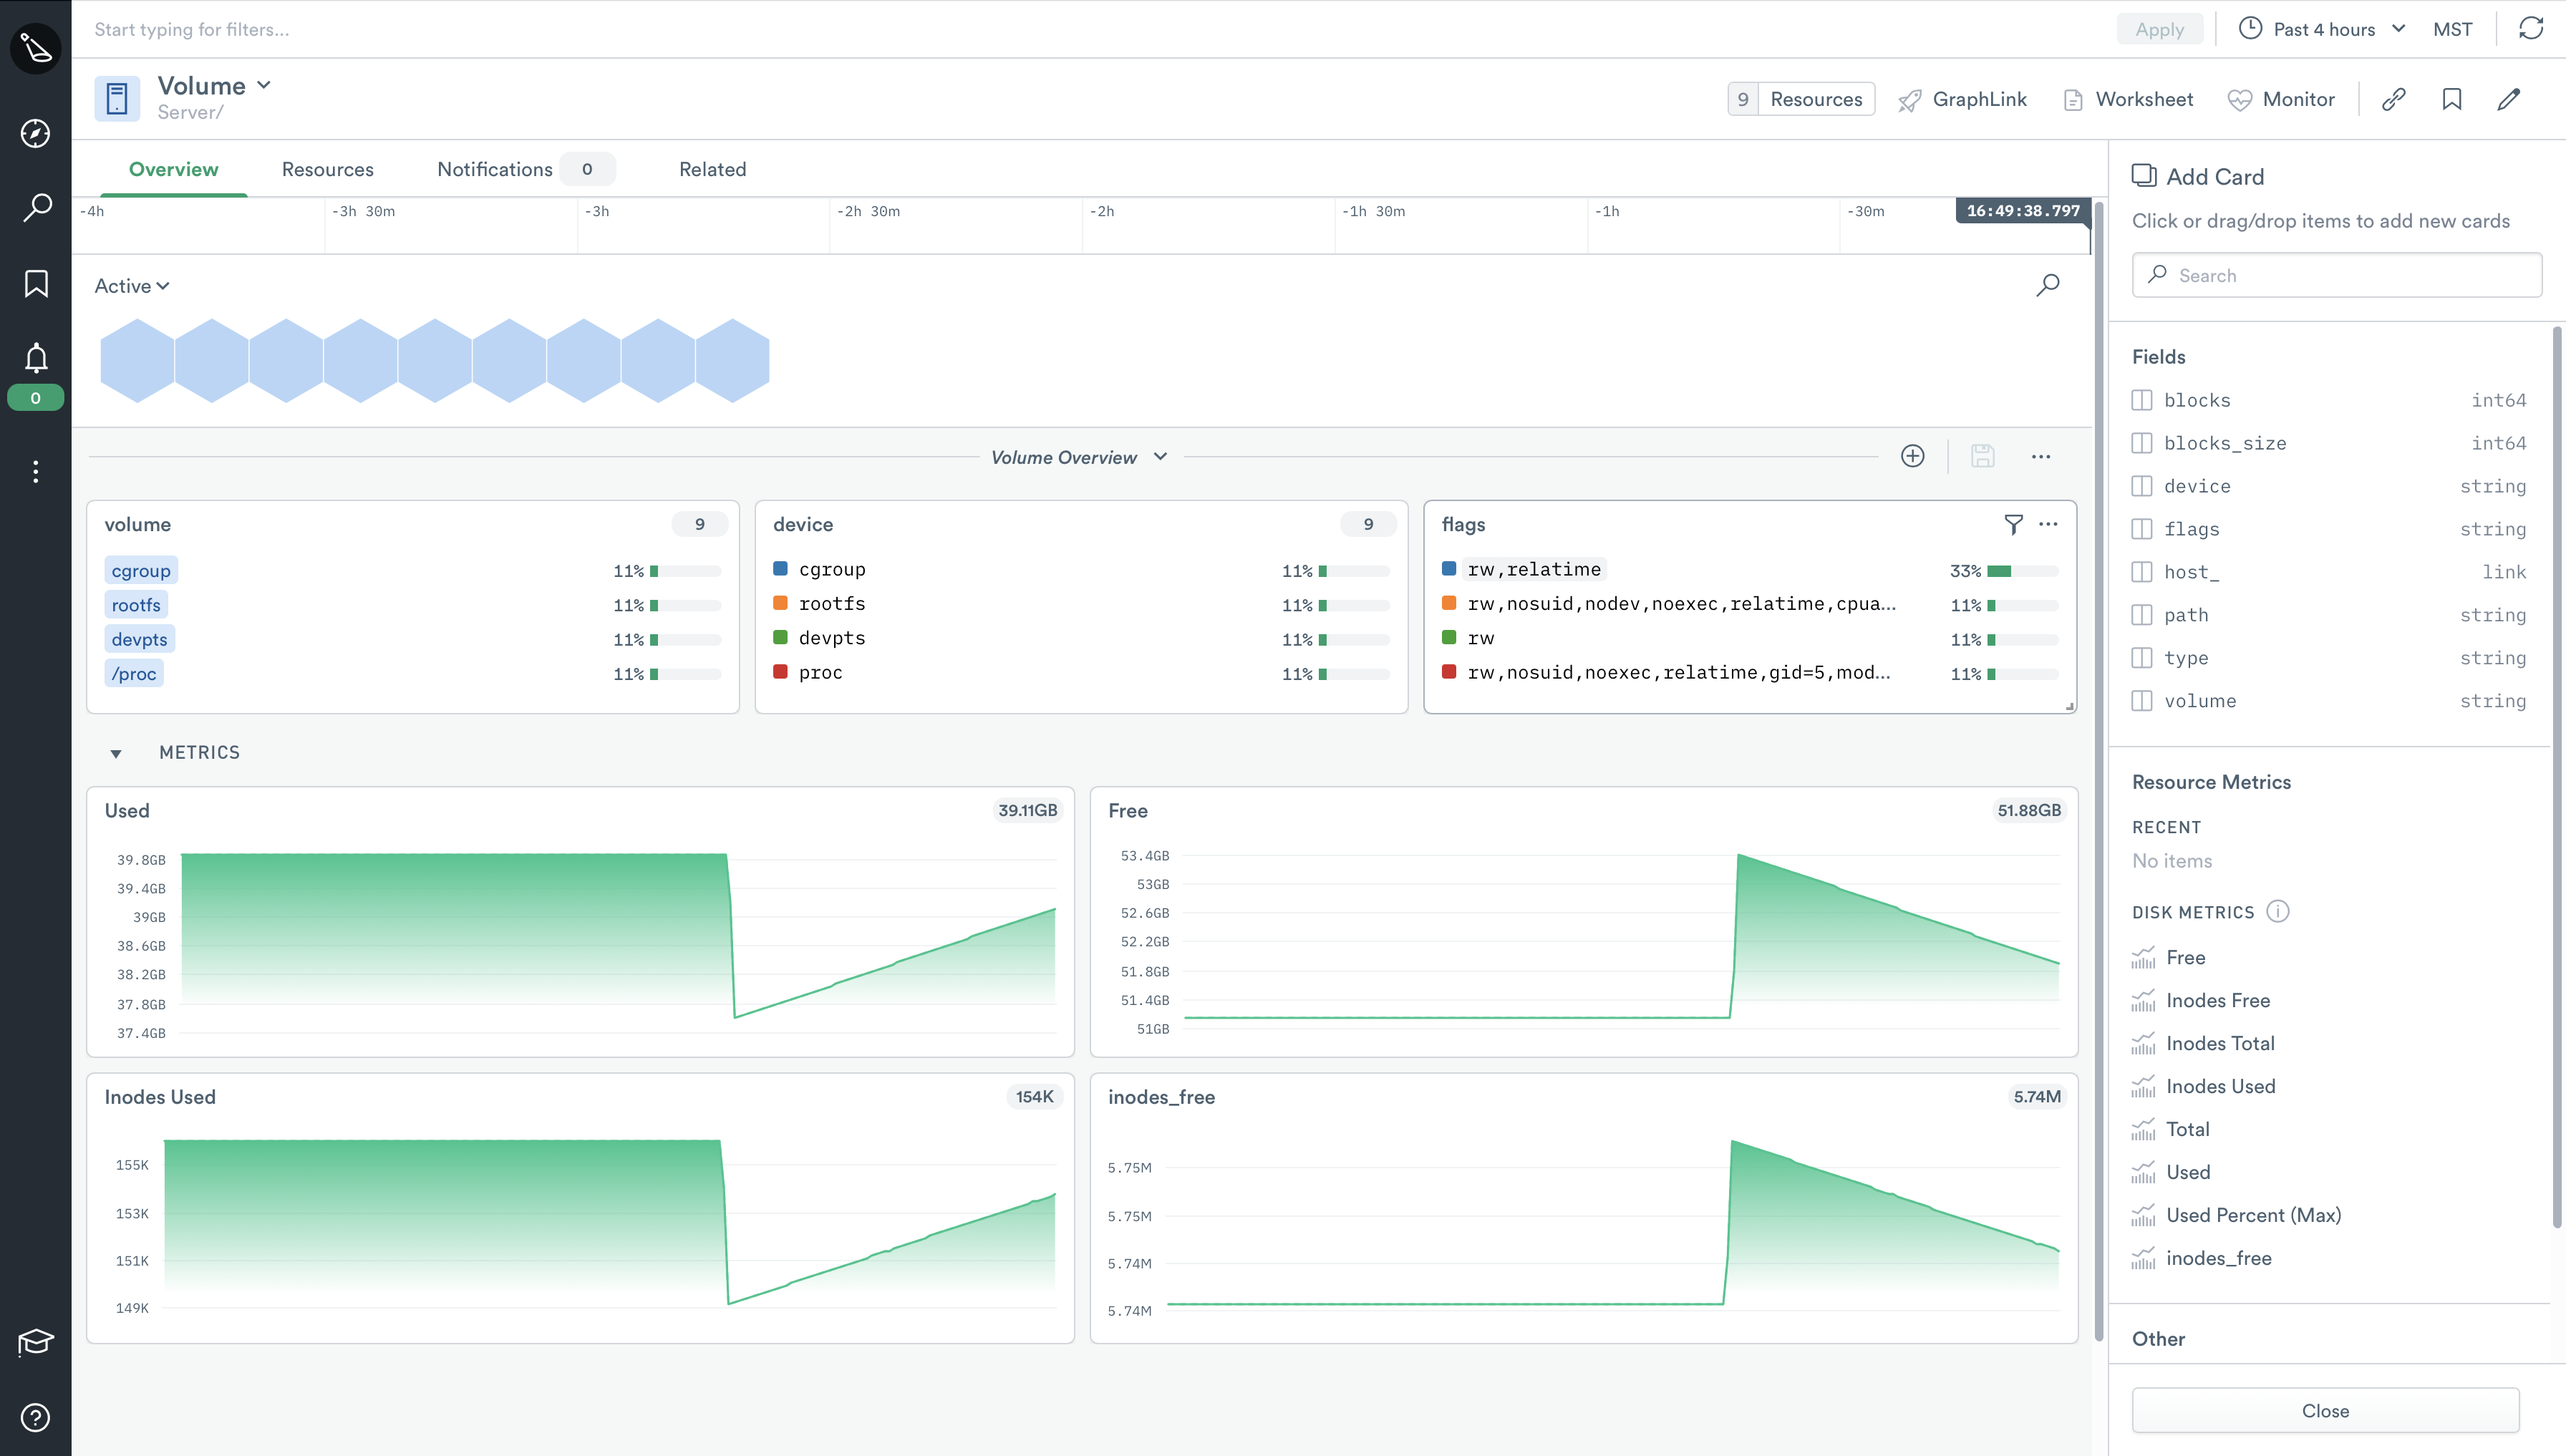
When you first browse the Volume dataset, you’ll notice the default dashboard provides many of the common metrics you’d expect to see in regards to volumes. However, just as with the Host dataset — and any other resource in Observe — you are free to add other metrics, as well as create as many dashboards as you like.
In the example above, we have very quickly created a visual display of inode usage for a particular volume, on a particular host, which we can then create a monitor for. This monitor can be easily scaled to include as many hosts as you have in your environment(s). A scenario such as this one can be useful for small hosting providers, companies who maintain their own data center, or even a single build machine.
In addition to the out-of-the-box datasets provided in this integration, you can easily link the Volume dataset to existing resources in Observe like application logs or even customer tickets to get full visibility into the impact your resources have on customers.
Interface
Similar to the other two datasets we’ve looked at, the Interface dataset contains many familiar metrics on its Overview page. Network device-related metrics such as packets in, packets out, error rates, etc can be found here.
In this particular example, we utilized Observe’s innate ability to track resource state and correlate metrics across time to visually find where a network issue occurred. We then added a couple of key metrics to help us diagnose the issue and ultimately found this particular incident to be a non-issue as there were no packet errors at the time of the event.
Aside from troubleshooting issues with network connectivity, a host of other possibilities are possible with this new dataset.
For example, instead of doing this to get more granular network usage data from your AWS instances, you could easily import your AWS transfer cost data and link it directly to the Hosts dataset and then ultimately to the Interfaces dataset to visually see which hosts — and interfaces — drive the most data transfer costs. From there, you’re only a click or two away from creating a monitor to alert you when a host or interface goes over a predetermined threshold.
Use case
Acme corporation is always looking for ways to streamline their CI/CD processes, as they push code to production dozens of times a day. Like most companies, they can’t afford any downtime — so build time is crucial to their service delivery pipeline.
Olivia, one of Acme’s SREs, notices that build times seem to be taking longer on Jenkins shortly after she gets to work. She quickly logs into Observe and confirms her suspicion.

Instead of builds taking 30 seconds, they now seem to be taking nearly 10 minutes! Olivia knows that Acme’s engineers constantly tweak their build jobs to provide a more streamlined and efficient build process, so she jumps into Observe and takes a closer look at the Jenkins host.
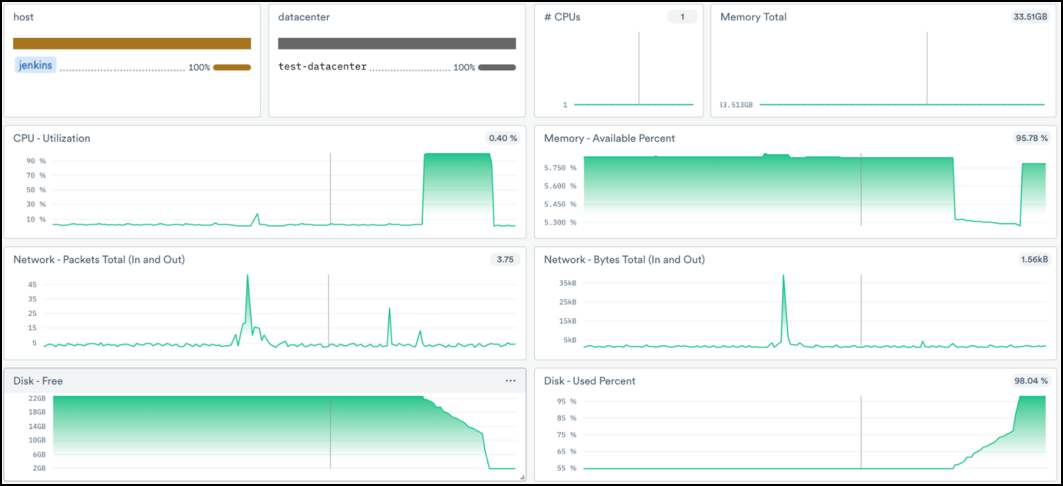
Olivia quickly notices that the build job spiked CPU Utilization, and seemingly the filesystem filled up at the same time. Ideally, Olivia would investigate the build pipeline to identify which step, or parameter, caused this problem, but the resource issue must be dealt with first. She quickly adds more CPU and storage resources to the Jenkins server — which only takes 5 minutes as it’s an EC2 resource in AWS — and fires off another build.

Et voilà! Olivia is an observability hero once again, and she can now take the time to properly investigate which change introduced this undesirable build time. Without Observe, Olivia would have had to open multiple browser tabs, make manual correlations between various datasets, and possibly involve other members of her team.
