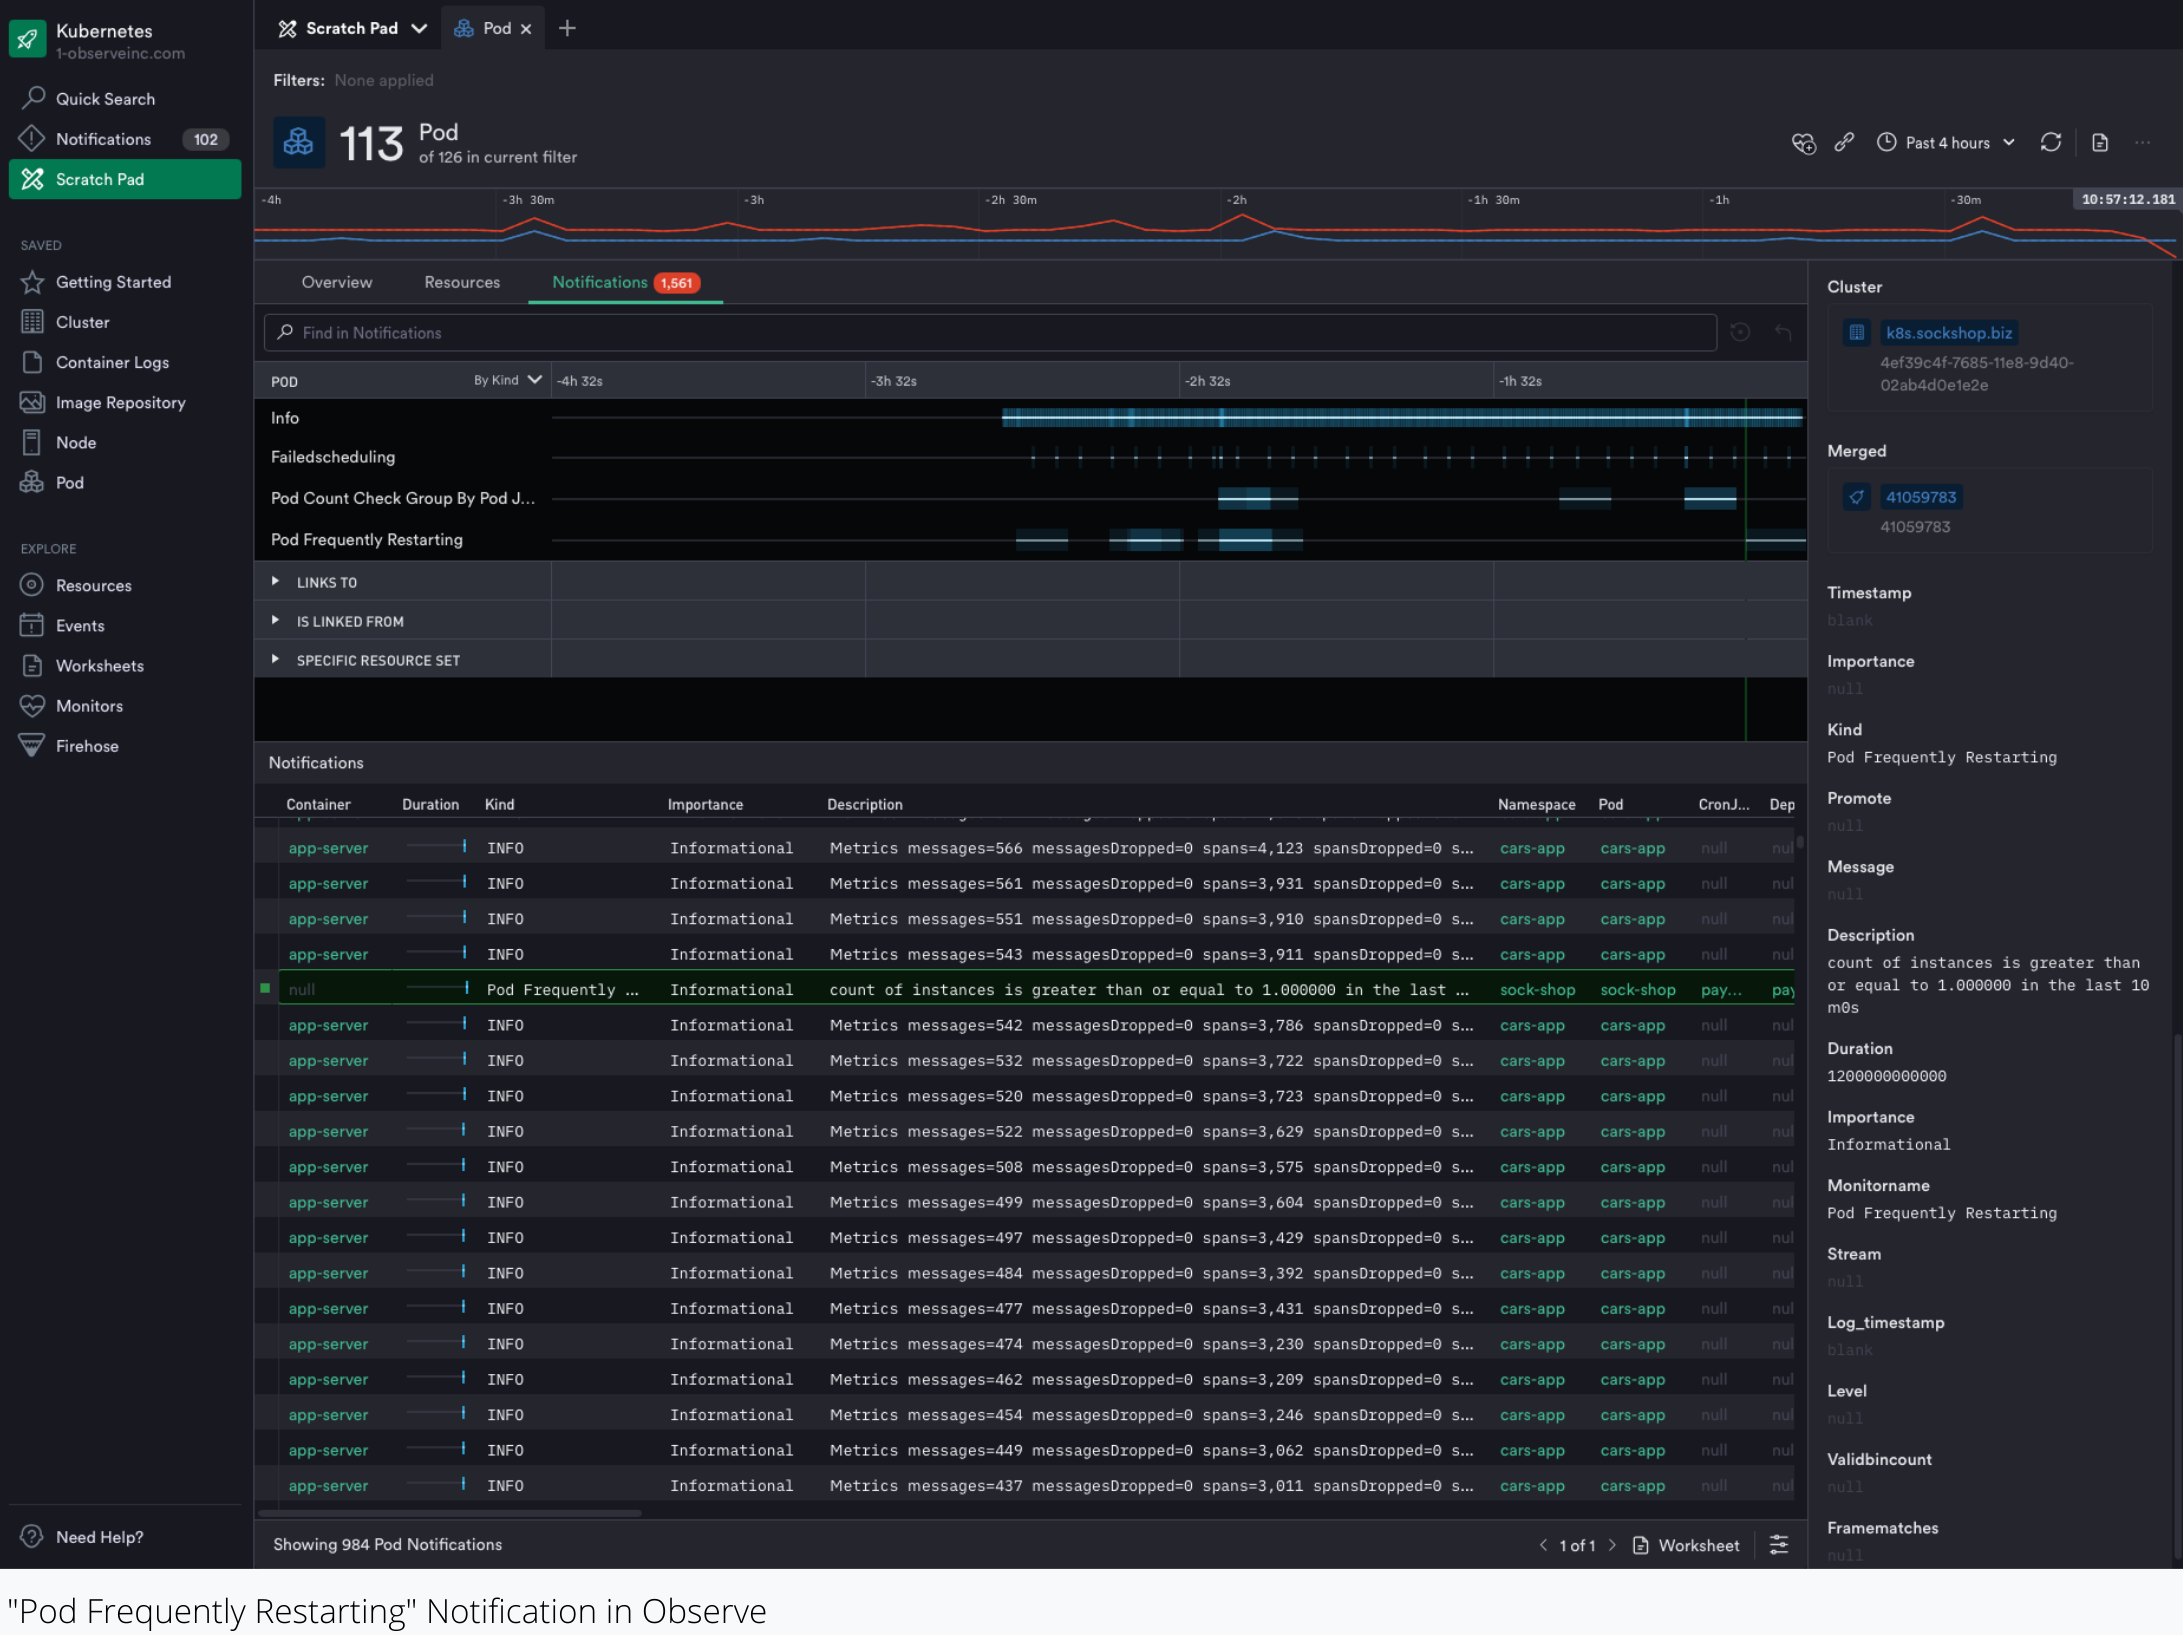
Customer Spotlight: TopGolf | A Hole in One For Observability
Observe was a no-brainer once I started looking into it.
Infrastructure monitoring is often one reason for deploying observability tools. But for Topgolf — a sports entertainment company with locations spread across four continents — monitoring infrastructure is only one of several observability goals. Equally important is the ability to monitor software delivery pipelines and run business analytics to ensure a great experience for every customer who plays at a Topgolf location.
With Observe, Topgolf’s engineering team implemented a single observability platform that serves all of these needs. By making it easy to link disparate data sources together, Observe provides Topgolf engineers with a centralized source of visibility and collaboration for managing multiple facets of the company’s operations. Ultimately, Observe helps Topgolf’s engineering team deliver an optimal customer experience and, in turn, increase business revenue and brand loyalty.
The Challenge: Siloed Telemetry Data and High Costs
Topgolf — founded in 2000 — operates more than 50 locations across the globe. The company’s DevOps team is tasked with maintaining reliability and optimizing the performance of both the IT infrastructure and the software stack that power all of these sites.
When something goes wrong — a server goes down, a container fails to start, or a microservice becomes slow to respond — the team needs to know immediately so they can respond quickly and resolve the issue before it impacts customers. Otherwise, customers’ entertainment experience will be disrupted, leading to reduced sales, lower customer engagement, and less frequent repeat business.

Originally, their engineers attempted to meet this challenge using a disjointed set of monitoring tools. They relied on Nagios and PRTG for infrastructure monitoring, while using the ELK stack to track release operations.
This approach proved problematic for a variety of reasons. One was that the company’s telemetry data was siloed, with different engineers using different tools for different purposes. The lack of a unified observability toolset made it very difficult to correlate data from multiple sources. Engineers struggled to understand how an infrastructure issue related to or impacted a software delivery issue, for instance. By extension, they were in a poor position to take a proactive approach to performance management. They waited for issues to become significant disruptions and then reacted to them, rather than identifying and assessing problems in their nascent stages.
At the same time, engineers found their incumbent tools to be unreliable and more costly than their performance warranted. The team’s ELK stack was hosted as a managed service on a major public cloud, “it periodically goes down and it’s a pretty expensive solution,” said Ethan Lilly, Engineering Manager at Topgolf. The company found that it was spending more than $70,000 per year on the ELK service alone, yet was getting little value from it.
The lack of value was all the more apparent given that the team’s ELK environment consisted of a single dashboard whose main purpose was to monitor the volume of data that ELK ingested. Rather than simplifying Topgolf’s observability challenges, the ELK stack added to them because the service became one more resource to monitor without offering much visibility in return.
Efficiency and usability in the team’s original tooling also suffered during the Covid-19 pandemic. Staffing reductions pushed engineers to find ways to do more with fewer resources — yet another catalyst for rethinking their observability strategy.
Embracing Data-Centric Observability
Seeking to eliminate silos of telemetry data, while also reducing costs and improving visibility, Topgolf’s engineering team began evaluating platforms that would allow them to unify their operations — including those involving infrastructure, software releases, and more — into a single tool. Their goal was not just to centralize their logging environment, but to also correlate those logs with metrics and other event data from across Topgolf’s sprawling infrastructure.
They initially considered Splunk but were concerned about the cost, as well as the complexity of unifying data sources on Splunk’s platform. In Observe, they found a solution that offered both compelling cost advantages and also the unified observability feature set they needed.
“Observe was a no-brainer once I started looking into it,” Lilly said. The platform costs 70 percent less than the solutions that his team previously used, while also delivering much higher rates of availability.
And most importantly, Observe makes it easier for engineers to shape and correlate data from disparate sources. They can compare performance data from different sites to understand the scope and impact of issues. Because they have a single source of truth, they can now join log and time-series data across infrastructure and applications to investigate complex performance problems. In turn, they can leverage Observe as a centralized point of collaboration for different teams within the IT organization — software developers, IT engineers, and more.
All of the above adds up not just to less time managing fragmented tools and data and more time working with. It also leads to a better customer experience, which is the ultimate driver of value. Thanks to Observe, disruptions in Topgolf games are fewer in number and, when they do occur, lesser in severity. As a result, customers play longer, buy more and make frequent repeat visits, strengthening Topgolf’s business.

“What we’ve gained with Observe is the ability to link our data in ways that we never could before,” Lilly said. “Being able to link the data alone between our microservices, our infra, ServiceNow” and so on has helped engineers identify “things we wouldn’t have even thought of linking before.”
Lilly added that Observe’s low learning curve has made it easy for Topgolf to expand the use of the platform rapidly. “A cool thing about Observe is that we can easily bring a lot more people onto the Observe platform without a ton of additional technical training. We can then all collaborate and dive into the data to solve issues, speed up our development pipeline, and innovate.”
“The ability to onboard engineers with Observe quickly is an especially important advantage for Topgolf as it prepares for a surge in business as the pandemic recedes”, Lilly said. “The company needs to expand its engineering team to accommodate business growth, and Observe allows it to do so seamlessly”.
But it’s not just engineers who stand to benefit from Topgolf’s adoption of Observe. Although the company has leveraged Observe primarily to help manage IT operations, Lilly said business analysts at the organization see potential in the tool as well. Namely, as a means of gaining deeper insight into business operations. “Going forward, the BI team wants to use the Observe platform to derive more statistics about our gameplay and similar data,” Lilly explained.
Conclusion: Observability That Works For Everyone
In short, Observe has made it possible for Topgolf to eliminate its data silos and increase visibility not just across infrastructure, but across the entire business. The company’s engineers can now readily correlate data from across their infrastructure and application stacks using a single platform, which in turn empowers them to continue scaling their observability operations to meet growing business demand.
Customer Video

